Bitcoin is bleeding again. After a brief bounce to $72,100, the price collapsed back toward critical support zones. Down 3% in 24 hours and nearly 38% since mid-January, BTC is testing the patience of even long-term holders.
The technical setup warned us weeks ago. Now on-chain data confirms what charts were screaming: conviction is cracking, and sellers are taking control. The big question? Whether $63,000 can stop the slide or if we’re headed for a deeper reset.
Bear Flag Broke Exactly as Expected
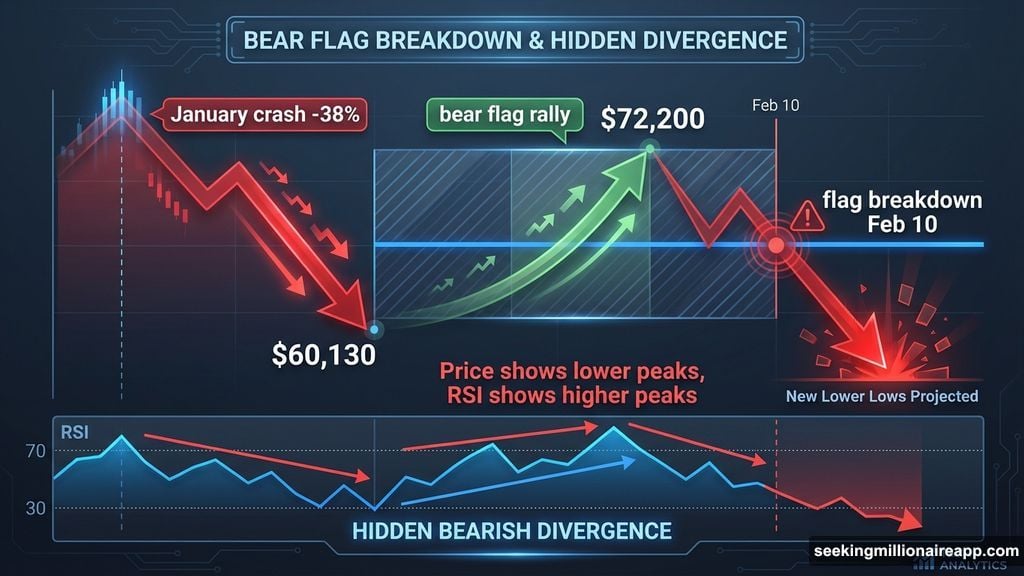
Technical analysts saw this coming. Bitcoin formed a textbook bear flag after the January crash—a sharp drop followed by a weak, narrow rebound. These patterns rarely end well.
From mid-January, BTC plunged 38% to around $60,130. Then it limped back up to $72,200 by early February. That weak rally formed the flag portion. On February 10, the price broke below the lower boundary, confirming the pattern failure.
But momentum indicators had already flashed warnings. The Relative Strength Index showed hidden bearish divergence between November 24 and February 8. While Bitcoin made lower highs on the price chart, RSI formed slightly higher highs. This disconnect reveals hidden selling pressure building beneath the surface.
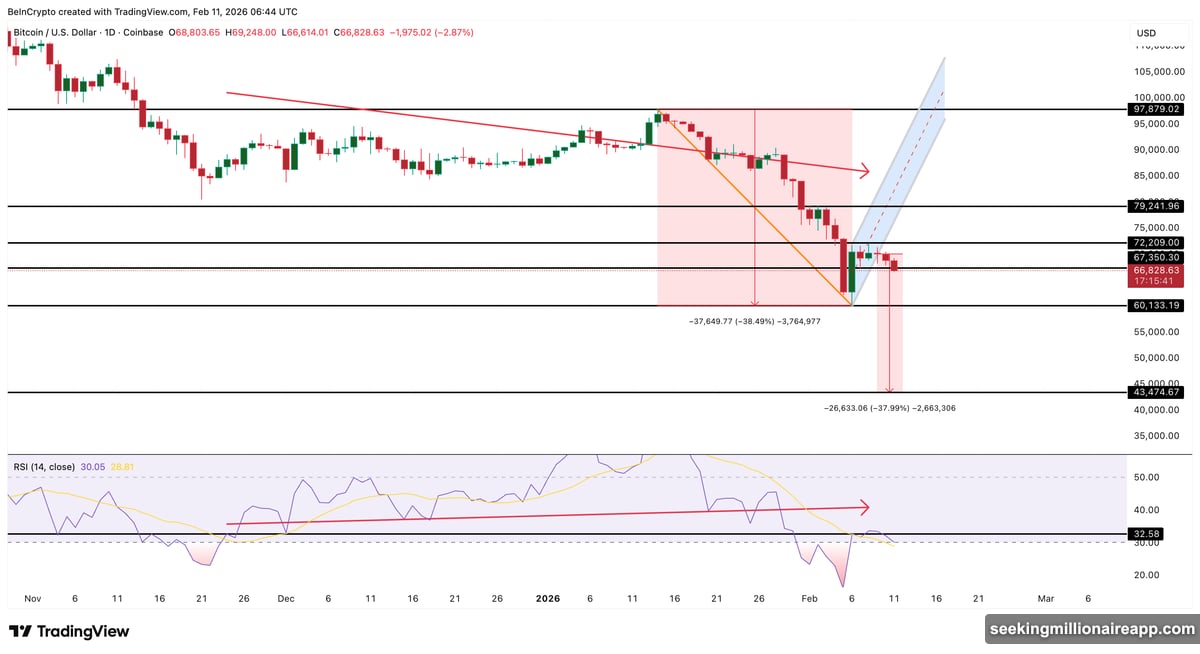
When RSI diverges from price like this, rebounds typically fail. And that’s exactly what happened. Once the rebound lost steam, sellers flooded back in.
Long-Term Holders Are Losing Faith
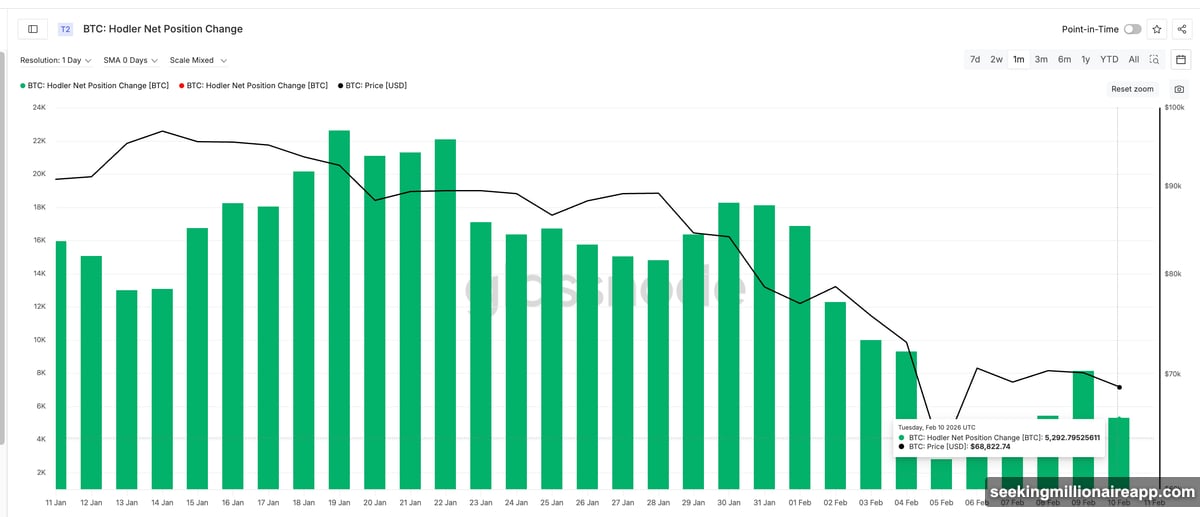
On-chain metrics paint an uncomfortable picture. The people who usually provide stability—long-term holders—are backing away.
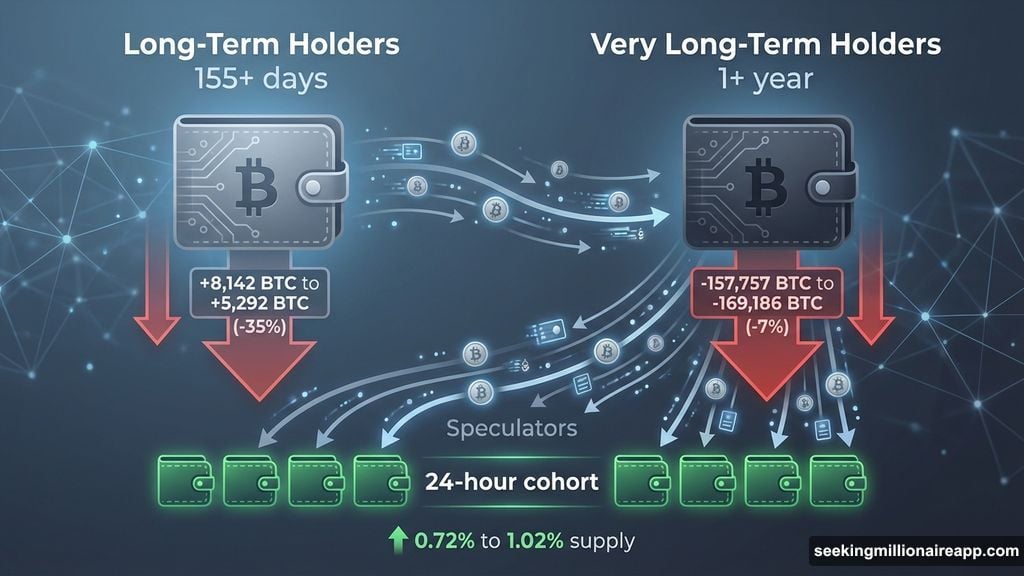
Hodler Net Position Change tracks wallets holding coins for more than 155 days. It measures whether these medium- to long-term investors are accumulating or distributing over 30-day periods. Between February 9 and February 10, this metric crashed 35%, dropping from around +8,142 BTC to roughly +5,292 BTC.
That’s a massive decline in accumulation. These holders aren’t buying the dip anymore. They’re stepping aside.
Meanwhile, very long-term holders (coins held over one year) are actively selling. Their Net Position Change widened from about −157,757 BTC to −169,186 BTC in just one day. That’s a 7% increase in selling pressure from the strongest hands in the market.
When both medium-term and very long-term investors reduce exposure simultaneously, downside risk multiplies.
Speculative Money Is Absorbing Supply
Here’s where things get concerning. While strong hands sell, short-term speculators are absorbing the supply. HODL Waves data shows the 24-hour cohort jumped from 0.72% to 1.02% of total supply between February 7 and February 10.
That’s a huge spike in fast-moving coins. These holders react emotionally to price swings and tend to panic sell during drops. This makes support zones far more fragile than they appear on paper.
So we’ve got a dangerous combination: experienced investors reducing conviction while nervous speculators increase exposure. This is the opposite of a healthy market structure.
The $63,000 Zone Is Bitcoin’s Last Line of Defense
Support levels aren’t random. They form where large groups of investors bought their coins and will defend their positions. Right now, the strongest cluster sits near $63,000.
UTXO Realized Price Distribution data reveals that roughly 1.3% of Bitcoin’s entire supply was accumulated around $63,100. That makes it a significant demand wall. Many holders are sitting right at break-even in this zone.
Bitcoin has already lost $67,350 and is drifting toward this critical level. If $63,000 holds, buyers might attempt to stabilize the market since so many investors would defend their entry prices.
But if it breaks? Risk escalates dramatically. A failure would push large groups into losses and could trigger accelerated panic selling.
Below $63,000, the next major support zone sits near $57,740. If that fails too, we could see a full reset down to $42,510. That would completely erase the recent bull structure.
Recovery Remains Distant and Difficult
On the upside, bulls face a steep climb. Bitcoin needs to reclaim $72,130 just to reduce immediate pressure. Only a move above $79,290 would meaningfully weaken the broader downtrend.
Until then, any bounces should be treated as corrective rallies within a larger downtrend. The path of least resistance remains lower.
The technical setup is bearish. On-chain behavior confirms weakening conviction. And speculative money is absorbing supply from experienced holders. That’s not a recipe for stability.
Everything now hinges on $63,000. It’s the market’s final clear line of defense before much deeper levels come into play. Whether it holds or breaks will determine if this is just another dip or the beginning of a genuine reset.
Watch that level closely. It matters more than most realize.