
Bitcoin’s yearly performance just turned slightly negative. That small red number might trigger something big.
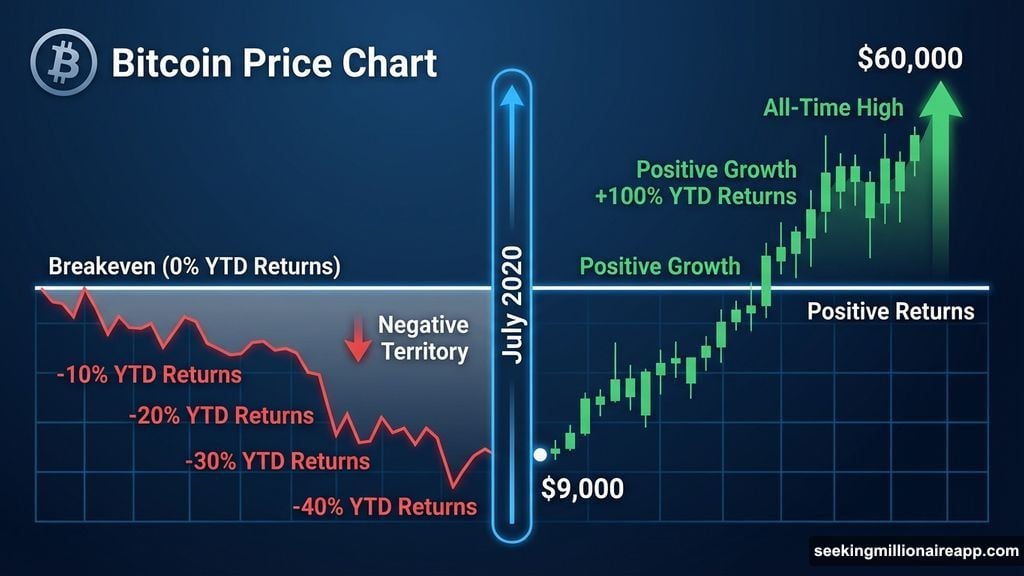
Right now, BTC trades roughly 4% below breakeven for the year. But history shows when Bitcoin flips from negative to positive annual returns, major rallies often follow. In fact, the last time this happened in July 2020, it kicked off one of crypto’s strongest bull runs.
Plus, three technical factors just aligned that haven’t appeared together since late 2020. So the question isn’t whether Bitcoin can move 4.5%. It’s whether this rare setup actually matters.
The 2020 Pattern Nobody Remembers
Bitcoin’s 1-year price change recently dipped into negative territory. Sounds bearish, right? Actually, it might be the opposite.
Historical data from Alphractal reveals something unusual. When Bitcoin’s annual return turns negative and then flips back positive, it has marked major trend reversals. The most recent example happened in July 2020.
Back then, Bitcoin briefly showed a negative yearly return before flipping green. What followed? A massive bull market that took BTC from around $9,000 to over $60,000 within nine months.
Now Bitcoin sits in a similar position. The yearly change hovers just below zero. A move of approximately 4.5% would flip it positive and repeat that exact historical condition.
Here’s what makes it interesting. This pattern rarely appears. Bear markets typically show sustained negative yearly returns. Bull markets maintain positive ones. But these brief negative flips during consolidation? They’ve proven to be inflection points.
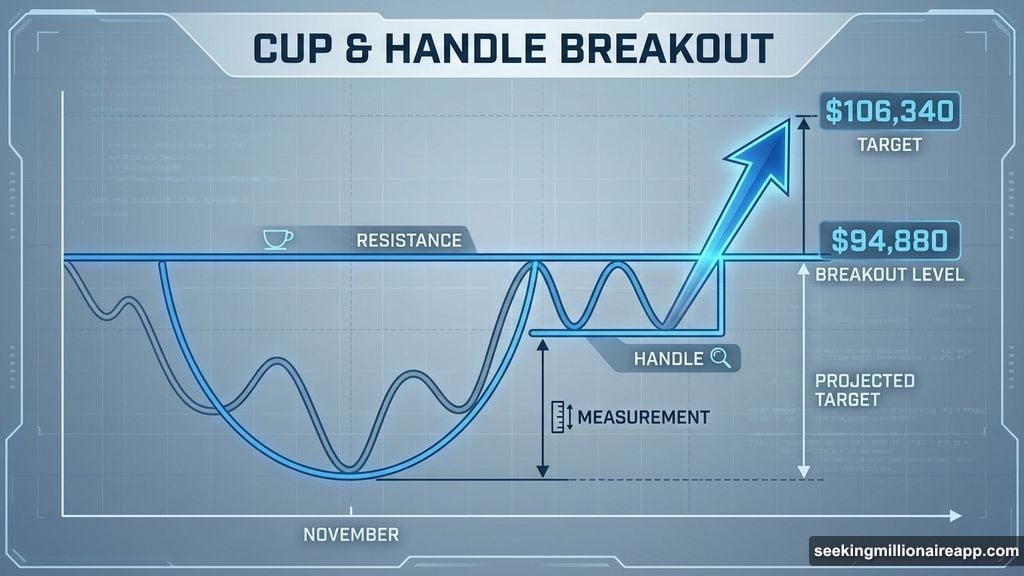
Cup and Handle Formation Points to $106,000
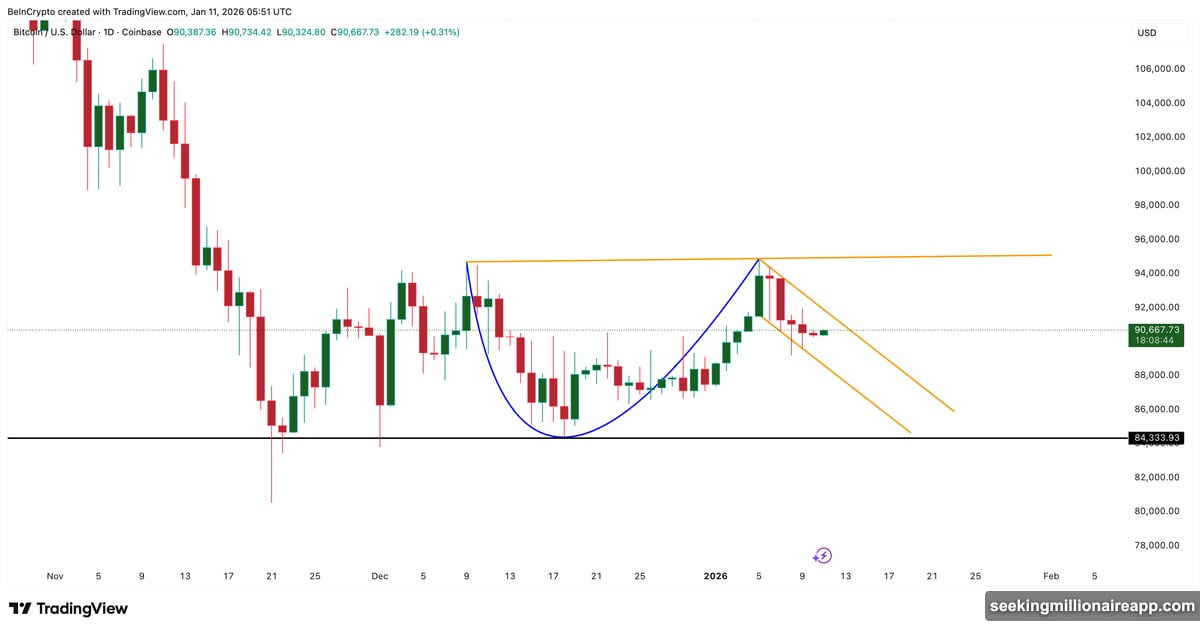
Technical structure supports the timing. Bitcoin is trading inside a cup and handle pattern on the daily chart.
This bullish formation shows a rounded recovery (the cup) followed by a sideways consolidation (the handle). The pattern completes when price breaks above the handle’s resistance level.
Bitcoin’s handle sits near current prices. The breakout level? Around $94,880. That’s the same zone where the 4.5% yearly flip would trigger.
Moreover, the measured move from this pattern projects to $106,340. That’s calculated by taking the cup’s depth and adding it to the breakout point. So if Bitcoin clears $94,880 decisively, technical analysis suggests a run toward $106,000 becomes likely.
The pattern has been building since November. Longer formation periods often lead to stronger breakouts when they finally occur.
Moving Averages Show Strength Returning
Short-term trend indicators are flashing green. Bitcoin recently reclaimed its 20-day exponential moving average (EMA) and continues holding above it.
EMAs weight recent prices more heavily than simple moving averages. That makes them more responsive to trend changes. Plus, Bitcoin has shown clear reactions to the 20-day EMA over the past two months.
In early January, BTC reclaimed this level and rallied nearly 7% within days. Then in mid-December, losing the 20-day EMA triggered a 6.6% correction. So this level matters for near-term direction.
The next resistance sits at the 50-day EMA. Bitcoin lost this level on January 12, which preceded a brief pullback. A clean reclaim would signal stronger trend recovery and align with the cup and handle breakout structure.
Right now, holding above the 20-day EMA keeps upside momentum intact. Losing it would put the bullish structure at risk.
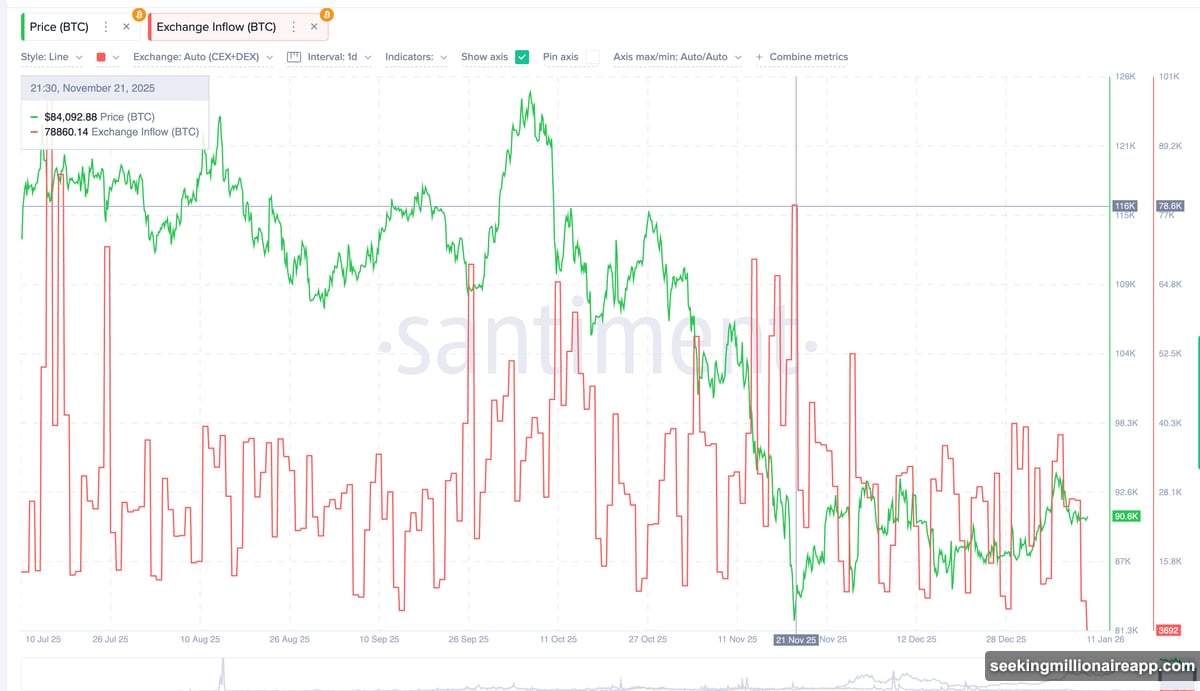
Selling Pressure Drops 95% in Six Months
On-chain data reveals a dramatic shift in supply dynamics. Exchange inflow, which tracks coins moving to exchanges, has collapsed to a six-month low.
Daily inflows dropped from roughly 78,600 BTC on November 21 to about 3,700 BTC now. That’s a decline of more than 95%. Fewer coins flowing to exchanges typically means less selling pressure.
Bitcoin holders appear reluctant to send coins to exchanges right now. That reduces available supply for sellers and can amplify upward moves when demand increases.
This pattern has preceded previous rallies. When holders stop sending coins to exchanges, it often signals confidence in higher prices ahead. The current six-month low in inflows suggests that confidence is building again.
Shorts Are Crowded at Critical Levels
Derivatives positioning adds fuel to potential moves. Over the next seven days, cumulative short liquidation leverage sits near $4.10 billion. Long liquidation exposure? Only about $2.17 billion.
That puts short exposure roughly 89% higher than longs. Crowded short positioning creates automatic buying pressure if prices rise. When shorts get liquidated, they’re forced to buy Bitcoin to close positions.
Bitcoin has repeatedly moved against leverage bias throughout 2025. So this short-heavy positioning becomes notable rather than bearish. If BTC starts climbing, forced short covering could accelerate the move higher.
Liquidation clusters appear between current prices and $95,000. Breaking through that zone would trigger cascading short liquidations that could push Bitcoin toward six figures quickly.
Three Price Levels That Matter Now
Everything converges at clear decision points. A daily close above $94,880 would complete multiple bullish setups simultaneously.
That level triggers the cup and handle breakout, aligns with the 4.5% yearly flip, and sits just above major short liquidation clusters. From there, upside targets include $99,810 and $106,340 based on Fibonacci extensions and pattern projections.
On the downside, $89,230 represents first critical support. Bitcoin found buyers there multiple times over the past month. A loss of that level would expose $86,650 and invalidate the bullish structure.
Between $89,230 and $94,880, Bitcoin sits in a narrow range. That 6% corridor will likely determine the next major move. Breakouts from tight ranges often lead to explosive directional moves.
The Setup Is Rare But Not Guaranteed
The pieces are aligning. Selling pressure hit six-month lows. Short-term moving averages show strength. A rare historical signal sits just 4.5% away. Plus, technical patterns point to significant upside if Bitcoin breaks resistance.
But setups don’t guarantee outcomes. Bitcoin could fail at $94,880 and retrace to support. Or it could chop sideways for weeks before making a decisive move.
What makes this interesting is the confluence. Multiple independent factors are pointing the same direction simultaneously. That doesn’t happen often.
Whether Bitcoin reaches that 4.5% flip may define what comes next. The 2020 parallel is intriguing but not predictive. Markets don’t repeat exactly—they rhyme.
Still, when technical structure, on-chain data, and historical patterns all align? That’s worth watching closely. The next few weeks will show whether this rare setup delivers or disappoints.