Bitcoin just punched through $72,000. Investors are feeling cautiously optimistic. But dig into the on-chain data, and a more complicated picture starts to emerge.
The cryptocurrency is trading at $72,521, holding just above the critical $72,294 support level. That’s good news on the surface. However, several key metrics suggest the path to $75,000 could be bumpier than bulls are hoping for.
Supply Profitability Signals Bear Market Territory
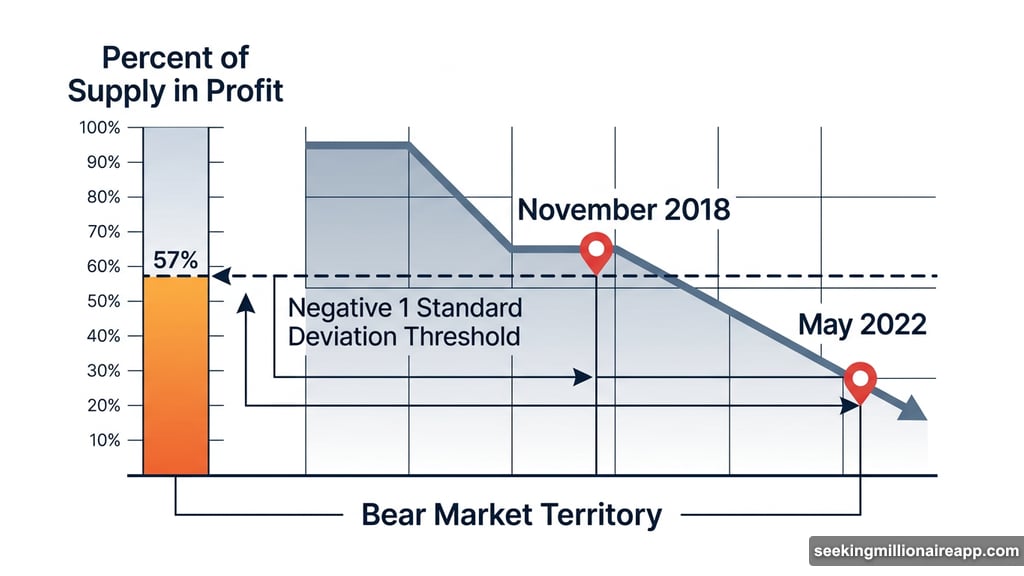
One metric in particular is flashing a warning sign right now. The Percent of Supply in Profit has dropped below its negative one standard deviation threshold, sitting at roughly 57%.
That number matters more than it might seem. Historically, readings at this level have marked the early stages of deep bear markets. Similar patterns showed up in May 2022 and again in November 2018, both of which preceded significant price declines.
So what does it mean in plain terms? Fewer Bitcoin holders are sitting on gains compared to previous periods. More people bought at higher prices and are now holding losses. And when underwater holders outnumber profitable ones at this scale, selling pressure tends to build steadily over time.
This makes a quick bounce-and-rally scenario much less likely. Instead, the data points toward a prolonged consolidation period with continued downward pressure in the medium term.
Short-Term Holders Could Spoil the Party
The Short-Term Holder (STH) On-Chain Cost Basis Bands tell a similar story. These bands have historically marked bottoming points during major corrections, including the June 2022 crash and the brutal March 2020 selloff.
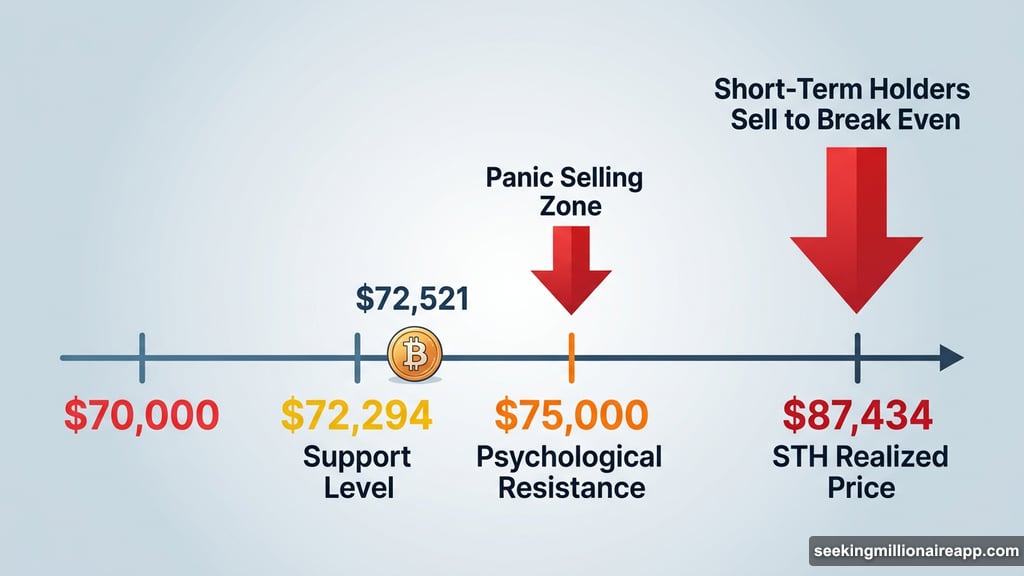
But here’s the catch. The STH realized price currently sits at approximately $87,434. If Bitcoin climbs toward that level, short-term holders who bought near the top may start unloading their positions just to break even.
That behavior creates a ceiling effect. Instead of Bitcoin sailing through recovery territory, it hits a wall of sell orders from people desperate to exit without a loss. Recovery rallies become harder to sustain when that kind of resistance builds overhead.
The $75,000 Question
At current prices, Bitcoin is holding its ground above $72,294. Keeping that support intact is the first test bulls need to pass.
But the bigger battle looms at $75,000. That level carries serious psychological weight, and panic selling often spikes near round-number resistance points. Even if buying pressure builds momentum, the combination of STH selling and reduced supply profitability could stall the move.
If bearish conditions hold, analysts see a realistic path toward $70,000, and potentially a dip below $65,000. Neither scenario is guaranteed, but neither can be dismissed given what the on-chain data currently shows.
On the flip side, a clean break above $78,363 would change the conversation entirely. That level would effectively invalidate the bearish case and signal that bulls have genuinely retaken control. Until that happens, though, caution makes sense.
Reading Between the Lines
The frustrating reality of Bitcoin right now is that both scenarios are plausible. The price is holding above critical support, and fresh optimism exists in the market. Yet the underlying data tells a more cautious story.
Short-term holders sitting near their cost basis, combined with a meaningful drop in supply profitability, creates a challenging environment for sustained upside. These aren’t just abstract metrics. They represent real people making real decisions about when to sell.
For anyone watching Bitcoin closely, the next few price levels matter enormously. A confirmed hold above $72,294 keeps recovery hopes alive. A push past $75,000 would be genuinely exciting. But the on-chain signals suggest patience may be the smartest strategy right now, rather than expecting a clean breakout on the first attempt.
Markets surprise everyone eventually. Bitcoin has done it before and will do it again. Just don’t let the short-term bounce distract from what the deeper data is quietly suggesting.