
Bitcoin price hasn’t moved much in 24 hours. BTC sits near $89,500, looking calm on the surface. But underneath, charts tell a different story.
Multiple technical signals suggest buyers aren’t pushing for gains anymore. Instead, they’re just trying to prevent a bigger drop. Plus, a new source of selling pressure is building quietly in the background.
Doji Candles Show Hesitation, Not Strength
Over the past three days, Bitcoin printed doji-like candles with thin bodies and long wicks. These patterns don’t signal balance between buyers and sellers. They show hesitation.
Sellers push lower. Buyers step in late. Neither side gains control. That’s not healthy price action.
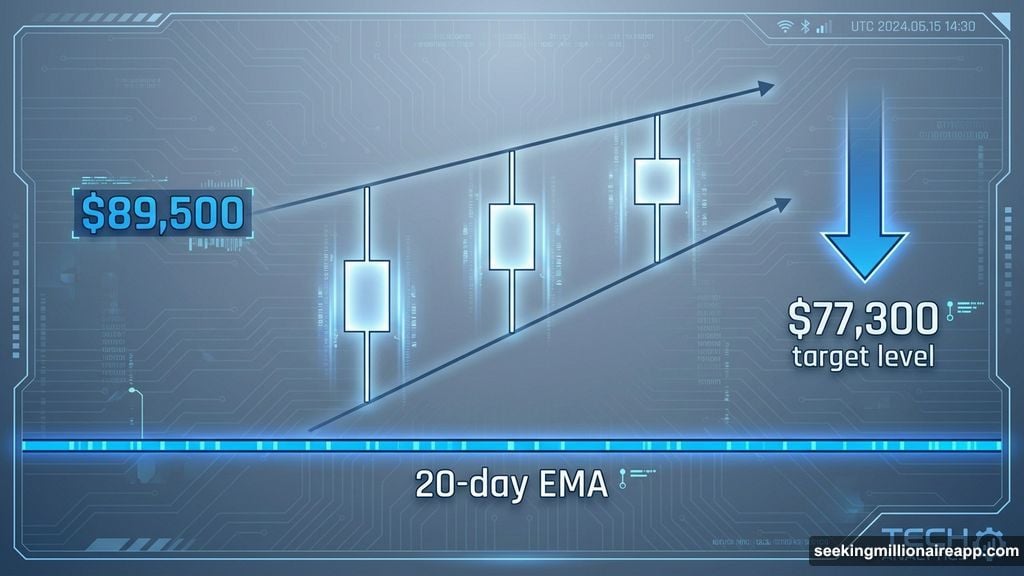
Moreover, this behavior appears right at the lower edge of a rising wedge pattern. Rising wedges slope upward but squeeze price tighter over time. They often break downward when support finally cracks.
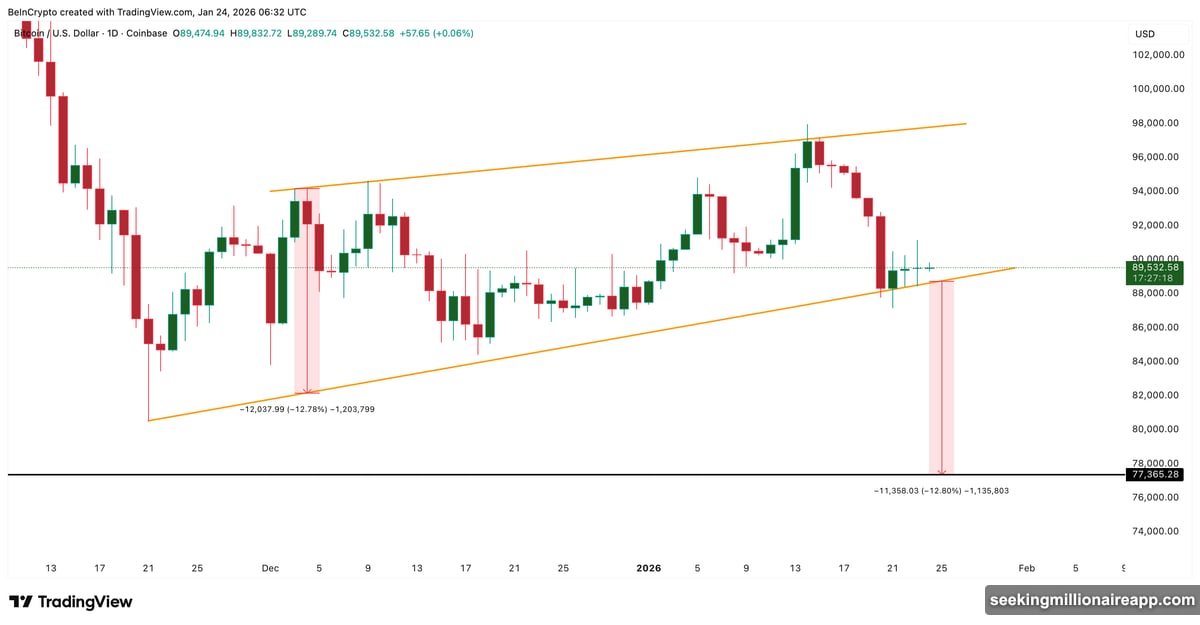
If this wedge fails, the measured target points to $77,300. That’s a potential 13% drop from current levels. So the technical structure already leans bearish.
Plus, Bitcoin lost its 20-day exponential moving average on January 20. An EMA weights recent prices more heavily, making it sensitive to short-term momentum shifts. The last time BTC clearly broke below this level, on December 12, it corrected roughly 8%.
This time, Bitcoin already slipped about 5% from that breakdown before stabilizing. The doji candles suggest buyers are slowing the fall, not reversing it. In fact, they’re defending ground, not advancing.
Long-Term Holders Still Buy, But Commitment Fades
On-chain data shows long-term holders, wallets holding Bitcoin for 155 days or more, remain net buyers. This group adds support that prevents immediate breakdown.
But the buying pace is slowing fast. On January 19, long-term holders added roughly 22,618 BTC. By January 23, that daily net buying dropped to about 17,109 BTC. That’s a roughly 24% decline in buying intensity in just four days.
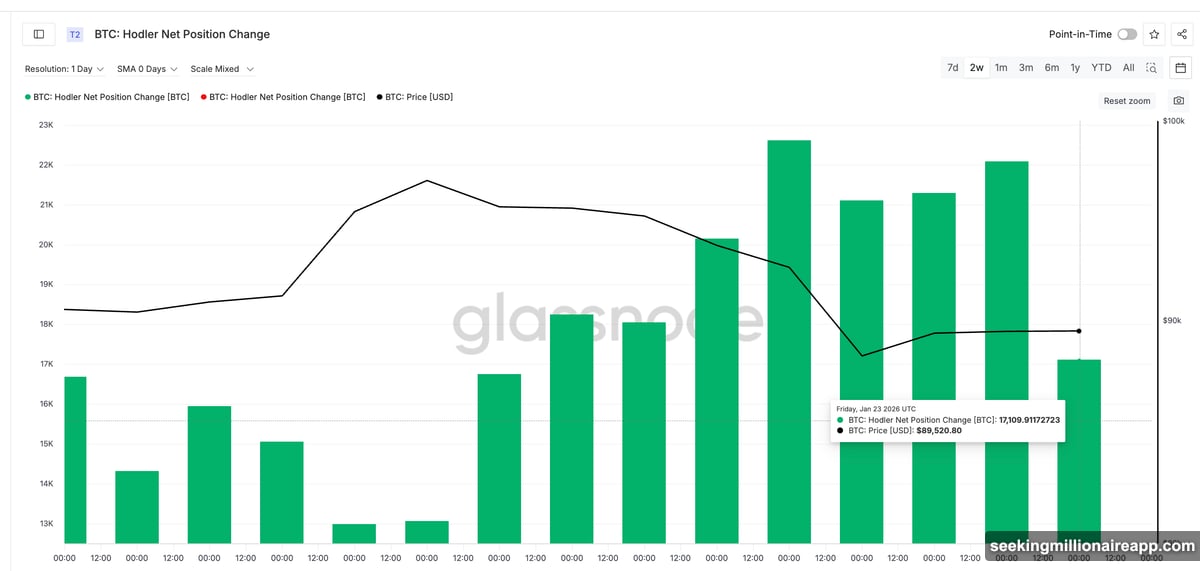
So while holders still support price, they’re doing so with less force. That aligns perfectly with the doji patterns on the chart. Support exists, but it’s thinning.
This slowdown wouldn’t be dangerous alone. However, a new adversary is emerging at the same time.
Miners Become the Hidden Threat
The most underappreciated shift right now comes from Bitcoin miners. Miner selling has surged dramatically over the past two weeks.
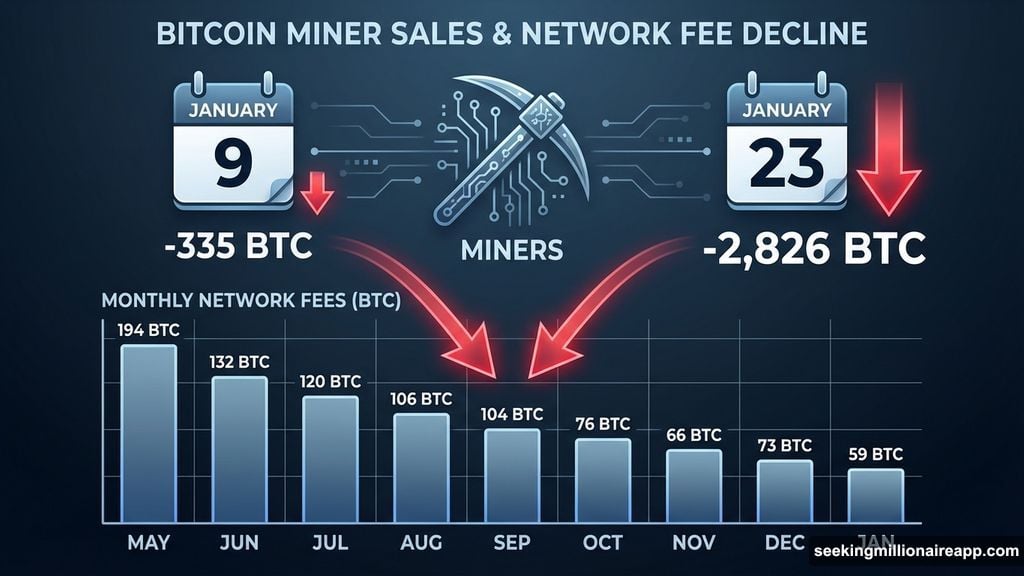
The Miner Net Position Change tracks the 30-day change in supply held by miner wallets. When this metric turns more negative, miners are selling more Bitcoin over time. On January 9, miners reduced holdings by roughly 335 BTC. By January 23, that figure jumped to about 2,826 BTC.
That’s more than an eightfold increase in selling pressure within two weeks. So what’s driving this surge?
Network fees collapsed. In May 2025, miners earned roughly 194 BTC in monthly fees. By January 2026, that figure steadily dropped to about 59 BTC. That’s roughly a 70% decline in fee income.
Lower fees squeeze miner margins hard. When revenue falls, miners sell Bitcoin to cover operating costs. That appears to be happening now.
Meanwhile, whale behavior is starting to soften too. Whale address counts rose steadily from January 9 through January 22, then began to flatten and slightly decline. This suggests early distribution, not aggressive dumping. But it adds to the pressure miners create.
Three Price Levels That Matter Now
Bitcoin now sits at a critical juncture. Price levels decide whether this standoff breaks bearish or buyers regain control.
At current prices near $89,500, Bitcoin needs a daily close above $91,000 to reclaim the 20-day EMA. That’s roughly a 1.79% move upward. Reclaiming this level would ease immediate downside pressure and signal buyers are regaining control.
The risk sits closer. A daily close below $88,500, about 1% lower, would place Bitcoin back under rising wedge support. If that happens, downside targets open quickly.
Key levels to watch include $84,300 first, followed by the wedge projection near $77,300. If long-term holder buying continues to slow while miner selling persists, those levels become increasingly relevant.
The Market Waits on Edge
Bitcoin’s current price action reflects a standoff, not stability. Buyers are present but weakening. Miners are selling at the highest rate in weeks. Long-term holders are slowing their accumulation.
Technical patterns suggest a breakdown is more likely than a breakout. The rising wedge, doji candles, and lost 20-day EMA all point toward further downside risk. Plus, the fundamental driver, collapsing miner fees, isn’t going away quickly.
For now, Bitcoin holds near $89,500. But charts warn this calm won’t last. The next move will likely be decisive, and current signals favor sellers over buyers. Watch those key levels closely.