
Bitcoin has barely moved in the past 24 hours, hovering around $67,600. Sounds calm. But zoom out to the past month and the picture gets ugly fast.
The price dropped roughly 27% over 30 days. And that quiet pause you’re seeing right now? It might not be recovery. It could just be a brief hold before the next leg down. One powerful group of holders is flashing the clearest warning signs yet, and the data is hard to ignore.
The Bear Flag Already Broke Down
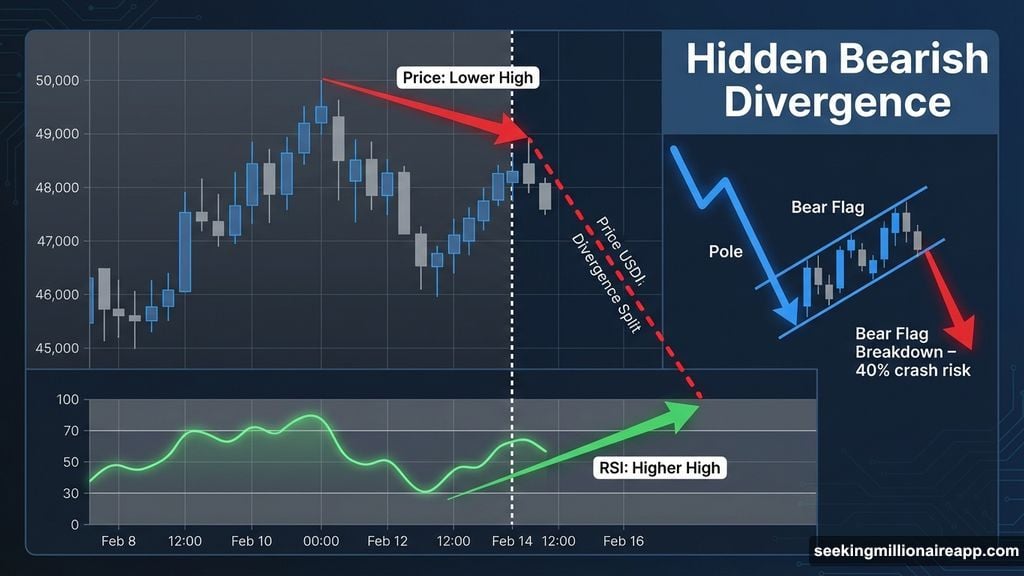
Bitcoin broke down from a classic bear flag pattern. That structure alone carried about 40% crash risk from the breakdown point. But the chart pattern isn’t even the scariest part.
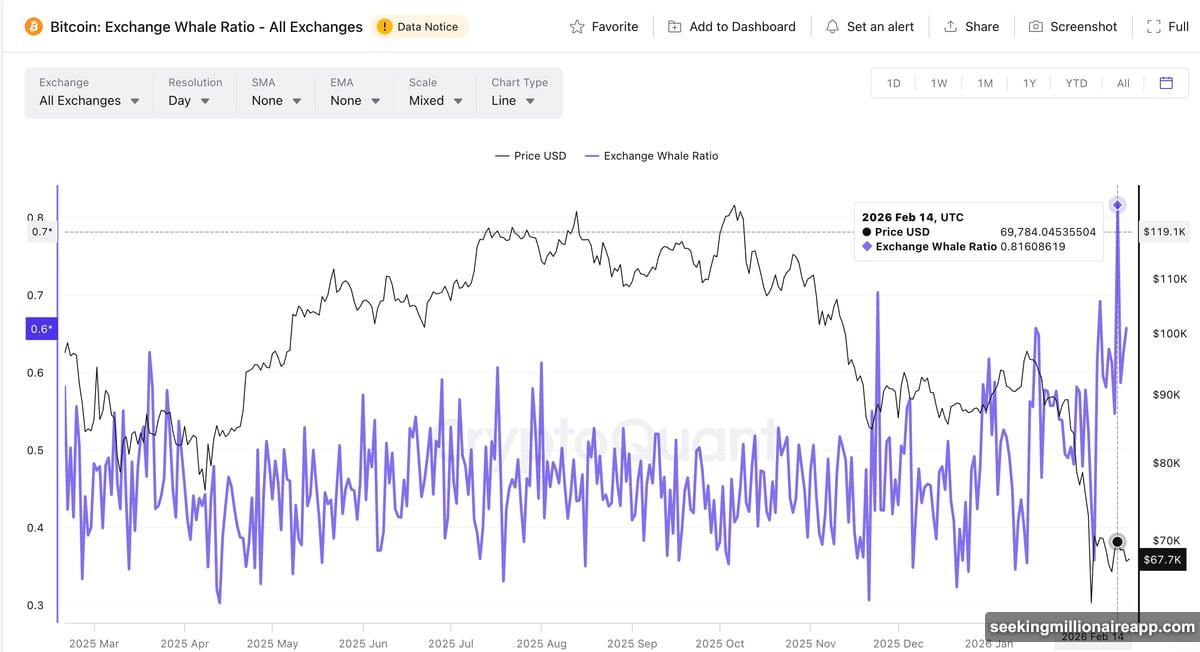
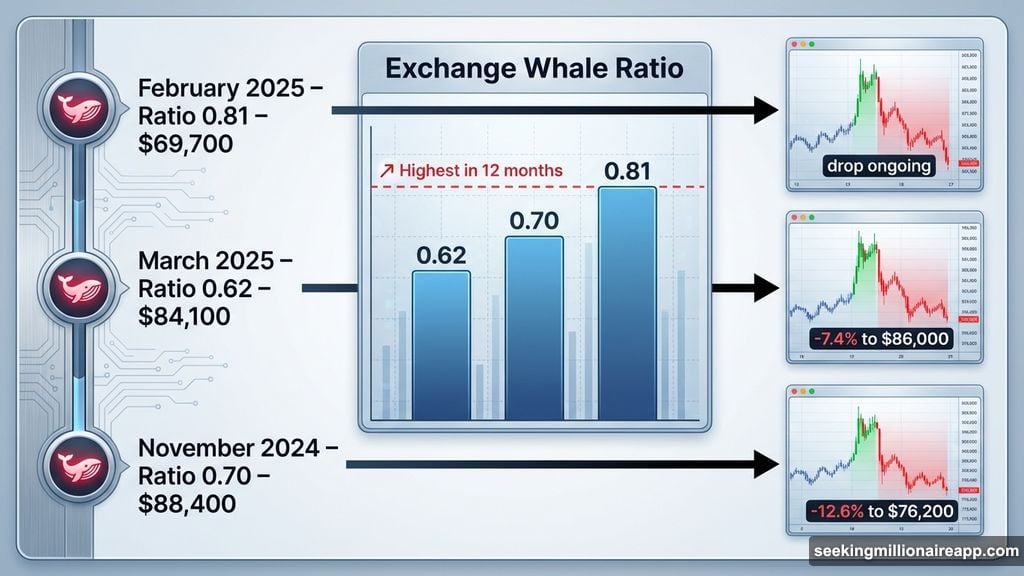
What’s really raising alarms is the Exchange Whale Ratio. On February 14, it spiked to 0.81. That’s the highest reading in a full year. This metric tracks the ratio of the top 10 whale inflows against total exchange inflows. When it rises, big holders are moving coins onto exchanges. And historically, that means one thing: they’re getting ready to sell.
The history here is genuinely worth paying attention to.
Whale Distribution Patterns Keep Repeating
Back in March 2025, the Exchange Whale Ratio hit 0.62 when Bitcoin sat around $84,100. Price briefly surged about 3.7% to $87,200 as whales positioned ahead of the move. Then came the crash. Bitcoin fell roughly 12.6% to $76,200 as distribution kicked in.
The same thing played out in November. The ratio spiked to 0.70 near the $88,400 price level. Bitcoin popped about 5.2% to $93,000, then collapsed roughly 7.4% to $86,000 by mid-December.
So the playbook is consistent. Whales buy early, price pops briefly, then the heavy selling begins and everyone else takes the hit. Now the ratio hit 0.81 in mid-February when Bitcoin was trading near $69,700. That’s the biggest whale metric spike in 12 months. Price has already started falling and currently sits near $67,000. But the ratio is still elevated at 0.65, which historically sits in profit-booking territory based on past corrections.
Another short bounce followed by a deeper drop isn’t off the table at all.
Hidden RSI Divergence Adds to the Concern
There’s a bearish divergence forming on the 12-hour chart between February 8 and February 16 that’s worth flagging. During that period, Bitcoin’s price made a lower high. Meanwhile, the Relative Strength Index (RSI), which tracks momentum, made a higher high.
That kind of split signal is called a hidden bearish divergence. It typically suggests the pullback will continue rather than reverse. So you’ve got three signals pointing the same direction: the bear flag breakdown, the elevated whale ratio, and this RSI warning. None of them are pointing toward recovery right now.
20 Whale Addresses Vanished During the Drop
Some analysts argue the Exchange Whale Ratio spiked simply because total exchange inflows dropped, making the whale portion look bigger by comparison. Fair point. But the actual whale address counts tell a clearer story.
The number of Bitcoin addresses holding 1,000 BTC or more dropped from 1,959 on January 22 to 1,939 currently. That’s 20 whale addresses disappearing during the correction. These large holders didn’t vanish randomly. They distributed their holdings as the price declined.
Here’s what makes that significant. When strong holders buy during weakness, it creates upward pressure and supports price recovery. When they sell during weakness, it accelerates the decline. These whales didn’t buy the dip. Based on the data, they created the dip. Bitcoin’s 27% monthly drop makes a lot more sense when you factor in at least 20,000 BTC exiting the market from those addresses alone.
The $66,800 Supply Cluster Is the Key Level
Now for the part that really matters for where price goes next. UTXO Realized Price Distribution (URPD) analysis shows where the most supply was created across the market. These zones act as powerful support or resistance depending on which direction price is moving.
The strongest current cluster sits near $66,800. That’s the biggest cost basis zone in the near term and the level where the most coins were last moved. Breaking through a zone like this requires serious selling pressure. Retail traders simply don’t have the size to push through such a concentrated supply cluster. Only large holders, meaning whales, carry enough firepower to do it.
And those same whales are already distributing. The Exchange Whale Ratio confirmed it. The address count drop confirmed it. They are actively selling into the market right now.
$60,000 Is the Next Stop If Support Breaks
Bitcoin currently trades just 1.6% above the critical $66,600 support level. That level aligns almost exactly with the $66,800 URPD cluster. They represent the same technical and supply-based zone from two different analytical angles.
If whales keep distributing, this level probably won’t hold. A break below $66,600 opens a direct path toward $60,000. That’s about 12% additional downside from current price levels.
Bitcoin briefly touched this zone on February 6 before bouncing back. But the setup looked much cleaner then. The whale ratio wasn’t at yearly highs. Hidden bearish divergence hadn’t formed yet. Now both warnings are flashing simultaneously while price hovers just above that critical supply cluster.
Breaking $66,600 would likely trigger cascade selling. Holders who bought near the $66,800 cost basis would panic. Leveraged long positions set up for a recovery bounce would get liquidated. The drop toward $60,000 could actually happen faster than the initial breakdown did.
On the upside, Bitcoin needs a clean move above $71,600 to show any real sign of buyer control returning. Full invalidation of the bearish setup only comes above $79,300. Until price reclaims that level, the bear flag breakdown stays active and downside risk dominates the picture.
The signals are all pointing the same direction. The whale data is unusually consistent. And the price is sitting right at the edge. That’s not a comfortable setup for anyone holding Bitcoin right now, and the next few days around that $66,600 level will tell us a lot about where this goes.