Bitcoin made headlines this week. A sharp 18% recovery from February lows near $62,530 pushed prices briefly to $74,150. Sounds like a comeback. But the on-chain data tells a very different story.
BeInCrypto’s own on-chain research, combined with Glassnode’s latest Week On-Chain report, paints a picture of a market distributing into relief. Not one building toward a new leg higher. And the warning signals are stacking up fast.
The Profit Signal Has a Bear Market Feel
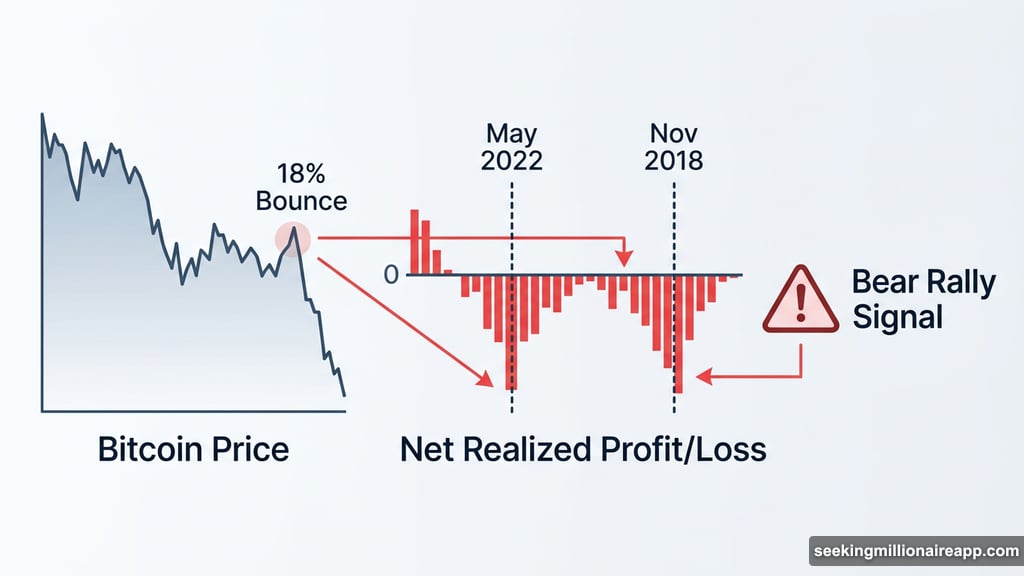
The clearest red flag comes from Bitcoin’s Net Realized Profit/Loss. This metric tracks the difference between profits and losses locked in by on-chain activity.
Since early January, this indicator has stayed in negative territory. That means more value is being destroyed on-chain than created. And here’s the scary part — the pattern closely mirrors two critical moments in Bitcoin’s history.
Specifically, the weeks before the May 2022 crash. And the months leading into the November 2018 collapse. Both periods saw extended losing streaks that preceded severe downside, not recoveries.
What makes this harder to ignore? The signal is persisting even as prices bounce. Historically, moves without a corresponding uptick in net realized profit tend not to hold.
Bearish RSI Divergence Compounds the Warning
There’s also a technical layer that should worry bulls. The Relative Strength Index (RSI), which measures momentum, flashed a hidden bearish divergence between December 9 and March 4.
Bitcoin printed a lower high in price while RSI registered a higher high over the same period. When momentum strengthens as price weakens, it typically signals the rally lacks structural demand.
In plain terms: sellers are still running the show. They’re just quieter about it right now.
Supply Profitability Hits Bear Market Territory
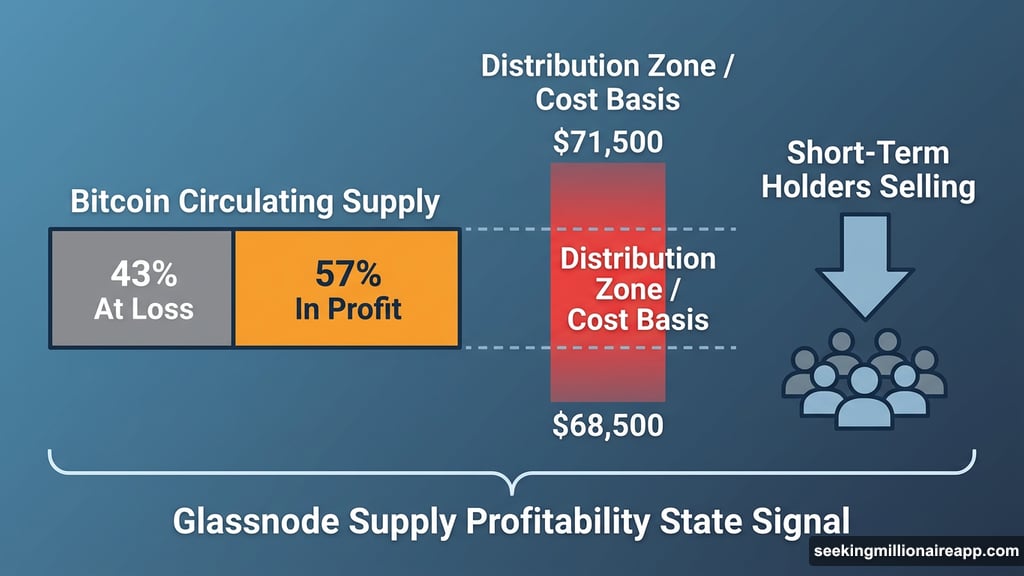
Glassnode’s Supply Profitability State Signal adds even more weight to this reading. This metric tracks the percentage of Bitcoin’s circulating supply sitting at an unrealized gain.
Currently, roughly 57% of supply sits in profit. That reading lands in a zone that has historically appeared at the early stages of prolonged bear markets. The most notable comparisons? May 2022 and November 2018.
So now two different metrics, built on two different methodologies, point at the same two historical parallels. That’s not coincidence.
Short-Term Holders Are Selling Into the Bounce
Glassnode’s Realized Price by Age metric reveals another uncomfortable truth. For Bitcoin buyers in the past one week to one month, the average cost basis sits near $70,000.
That creates a natural distribution zone between $68,500 and $71,500. Recent buyers approach breakeven in this range and choose to exit rather than wait for further upside. Classic sell-the-relief behavior.
BeInCrypto’s HODL Wave analysis confirms this is already happening. On February 19, when Bitcoin traded near $67,000, the one-week to one-month cohort held 6.20% of circulating supply. By March 5, with Bitcoin near $70,880, that figure had dropped to 4.54%.
Supply is leaving hands as price climbs. That’s not accumulation. That’s distribution into a bounce.
Open Interest Signals No Real Conviction
The derivatives market tells the same story from a different angle. Open interest — the total value of unsettled futures and perpetual contracts across exchanges — currently sits at about $24.29 billion.
For context, that’s less than half of the $47+ billion recorded during July 2025’s run toward all-time highs. The crowd simply isn’t building behind this move.
Glassnode’s perpetual directional premium data reinforces this point. That premium remains compressed, confirming that speculative long exposure is largely absent. There’s no fresh wave of leveraged longs fueling the recovery.
That might actually have one silver lining. Lower leverage means less risk of a violent cascade unwind if prices pull back. But it also means this rally has no engine.
The $75,000 Zone and What Happens There
The immediate resistance sits between $74,770 and $75,700 — essentially the $75,000 zone. And that level matters for a specific mechanical reason.
About $2.3 billion in negative gamma is concentrated there, with roughly $1.8 billion tied to the March 27 expiry alone. Negative gamma forces options dealers to buy as price rises and sell as it falls. Think of it as a dealer-driven short squeeze — not organic buying from traders, but mechanical hedging.
As price approaches $75,000, dealers must keep buying to hedge their exposure. That amplifies the move upward. But once price arrives at the strike? Those same dealers have nothing left to buy. The mechanical bid disappears.
Without fresh organic demand waiting above, price tends to stall or reverse sharply from these zones. Glassnode flags this as the key gamma magnet for the current move.
A daily close above $75,700 would meaningfully shift the narrative. Right now, $72,150 is the first resistance being tested.
Where the Critical Support Sits
On the downside, the range between $68,640 and $70,090 is the critical support band. This level converges with Glassnode’s short-term holder distribution floor — the zone where recent underwater buyers are most likely to capitulate if price revisits.
As long as Bitcoin holds daily closes above $68,640, tactical bounces remain valid. Below that, $67,200 and $65,410 become the next logical targets.
A sustained daily close breakdown under $68,640 opens the path toward the $62,520 swing low. That’s the worst-case scenario if distribution continues to accelerate.
The data isn’t saying a crash is certain. But it is saying this bounce hasn’t earned the label of recovery yet. Watch those levels closely before making any moves.