
Bitcoin jumped 9% last week and traders celebrated. Now the data shows they might have walked straight into a larger crash.
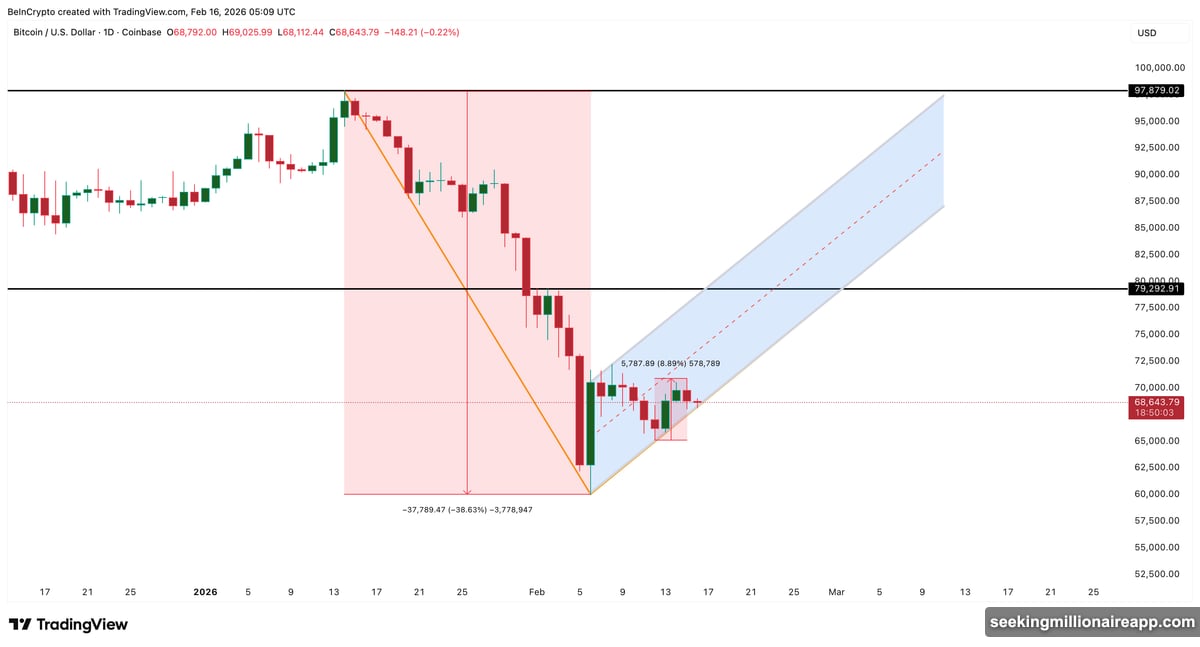
The price climbed from roughly $62,800 to around $68,500 between February 12 and February 15. That looked like recovery. But leverage exploded during the bounce, profit-taking signals flashed, and momentum indicators showed hidden weakness. Together, these factors suggest the rally may have amplified downside risk instead of eliminating it.
$2 Billion in Fresh Leverage Flooded the Market
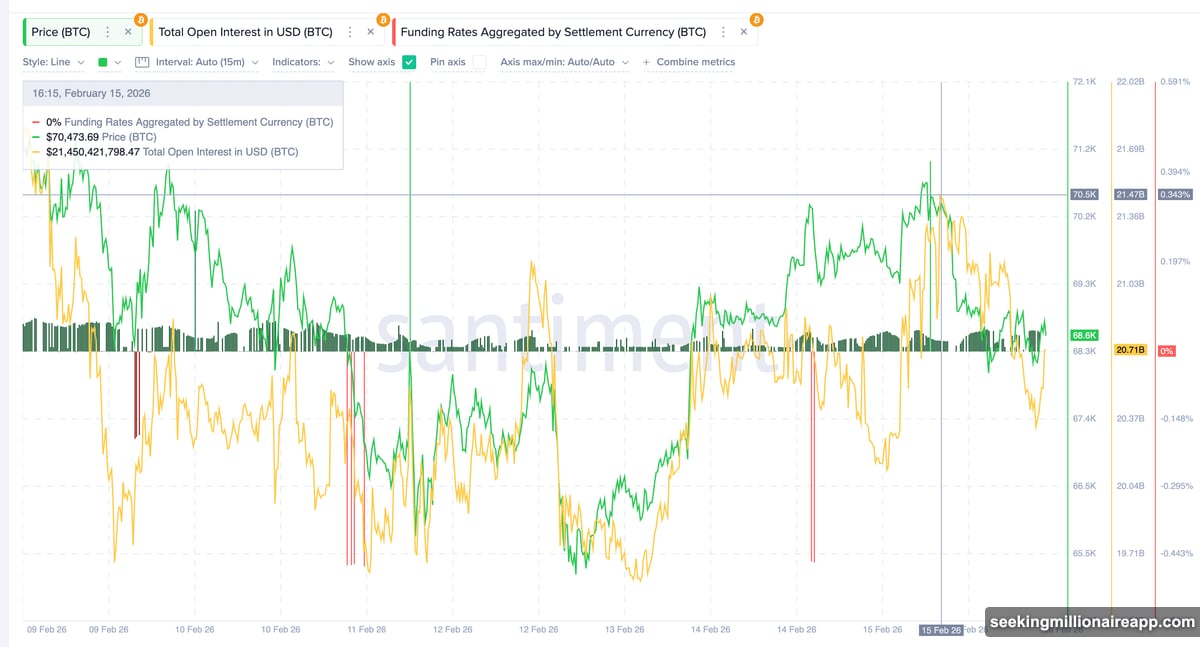
Futures traders went all-in during the bounce. Total open interest surged from $19.59 billion to $21.47 billion between February 13 and February 15. That’s roughly $1.88 billion in new positions, mostly betting on higher prices.
At the same time, funding rates spiked toward +0.34%. This metric tracks the fee that long traders pay to short traders. Positive funding rates mean most traders are betting on price increases. So the combination of rising open interest and strongly positive funding confirmed that optimism dominated.
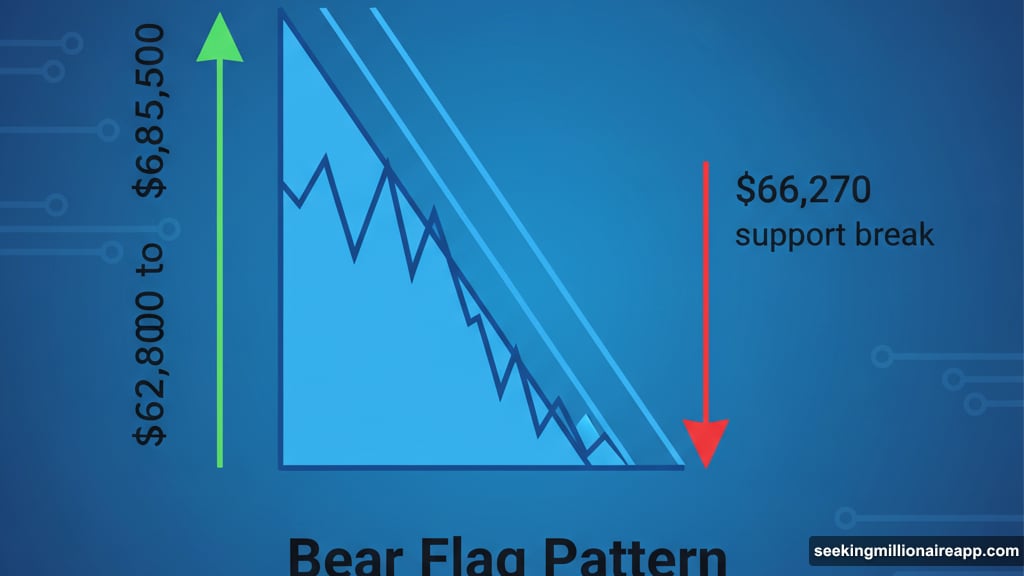
But here’s the problem. All of this happened inside a bear flag pattern.
Bear flags form when prices rise gradually after a sharp drop but stay contained within a downward-sloping channel. They typically signal continuation of the previous decline, not reversal. Bitcoin’s recent bounce fits this pattern precisely. Price rose inside a defined range, then got rejected near the local peak.
Now Bitcoin is drifting back toward the lower boundary of that flag. If it breaks below support at $66,270, the bearish pattern activates. That could trigger the next leg down.
Hidden Weakness Appeared While Prices Climbed
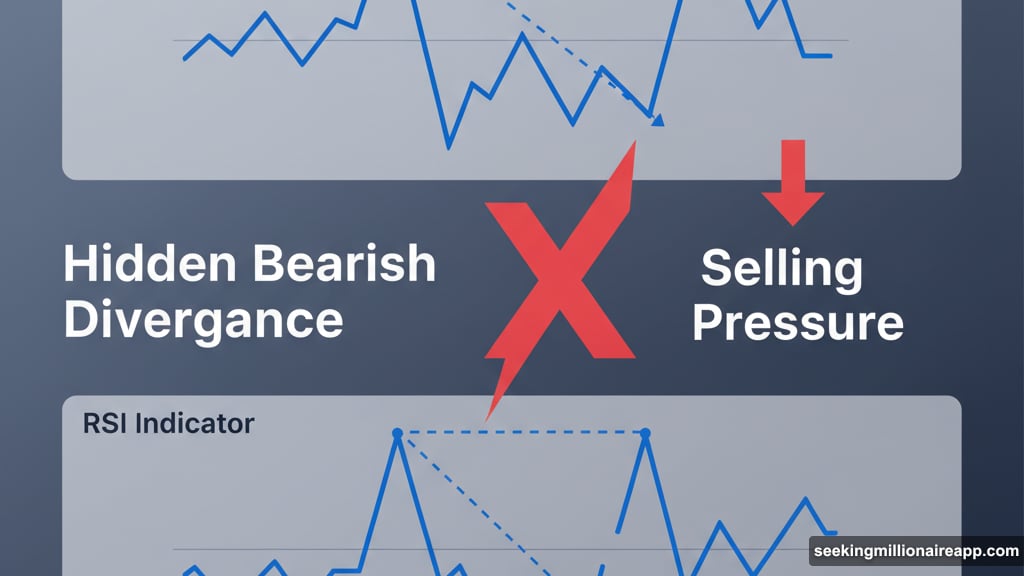
Momentum indicators revealed cracks beneath the surface. Between February 6 and February 15, Bitcoin formed a hidden bearish divergence on the 12-hour chart.
Here’s what that means. The price made a lower high during this period, showing the recovery was weaker than the previous peak. Meanwhile, the Relative Strength Index climbed to a higher high. RSI measures the strength of buying and selling pressure.
This mismatch creates hidden bearish divergence. It typically appears when buying momentum rises temporarily but the overall trend remains fragile. The signal warns that sellers are quietly regaining control even as prices tick higher.
Shortly after this divergence formed, Bitcoin’s pullback began. The price started dropping from its recent high, confirming the warning signal.
Profit Surge Matches Pre-Crash Levels
On-chain data added another red flag. Bitcoin’s Net Unrealized Profit/Loss jumped from 0.11 on February 5 to 0.21 on February 14. That’s roughly a 90% increase in just nine days.
NUPL tracks the average unrealized profit across all Bitcoin holders. It shows how much profit investors are sitting on without selling. Sharp NUPL increases create profit-taking risk. When many holders suddenly return to profit, even small amounts, they’re more likely to sell if prices start falling.
The last time NUPL reached similar levels was February 4. Bitcoin was trading near $73,000 then. Within one day, the price collapsed to around $62,800. That was a 14% drop.
Now NUPL sits at the same level again. This creates a dangerous setup. Fresh profits encourage selling. If prices start declining, that selling accelerates the move down. Combined with the hidden bearish divergence, this profit surge suggests the recent bounce may have strengthened sellers rather than removed them.
Support at $66,270 Decides the Next Move
Bitcoin now approaches its most critical support zone. The first key level sits at $66,270, near the lower boundary of the bear flag pattern. A break below this level would activate the bearish continuation signal.
If that happens, the next major downside target is $58,880. This aligns with the 0.618 Fibonacci retracement level, a structurally significant zone. Reaching this level would represent roughly a 14% decline from current prices.
Deeper selling could push Bitcoin toward $55,620, which matches the full projection of the bear flag structure. That would extend the correction significantly.
On the upside, Bitcoin must reclaim $70,840 to stabilize in the short term. A stronger breakout above $79,290 would fully invalidate the bearish pattern and signal that buyers have regained control.
Until then, risk tilts to the downside.
Why This Bounce Might Backfire
The recent rally improved sentiment briefly. Traders piled into long positions. Casual observers assumed the worst was over. But the data tells a different story.
Rising leverage increases volatility. When positions get liquidated, prices move faster in both directions. Hidden bearish divergence shows momentum fading even as prices rise. And the 90% profit surge mirrors conditions that preceded the last sharp drop.
These factors don’t guarantee a crash. But they create conditions where one becomes more likely. If Bitcoin breaks below $66,270, the pattern completes and selling pressure could accelerate rapidly.
Leverage-heavy markets tend to overreact in both directions. The recent bounce may have loaded the spring for the next move down. Watch that $66,270 support closely. What happens there determines whether Bitcoin stabilizes or drops toward the $58,000 zone.