Bitcoin dropped from $126,000 to below $102,000. Panic selling kicked in. But the data tells a different story.
Multiple technical indicators and macroeconomic trends suggest this pullback is temporary. In fact, selling at current levels could mean missing the next leg up. Let’s examine why the bull cycle still has room to run.
The 50-Week SMA Holds Strong
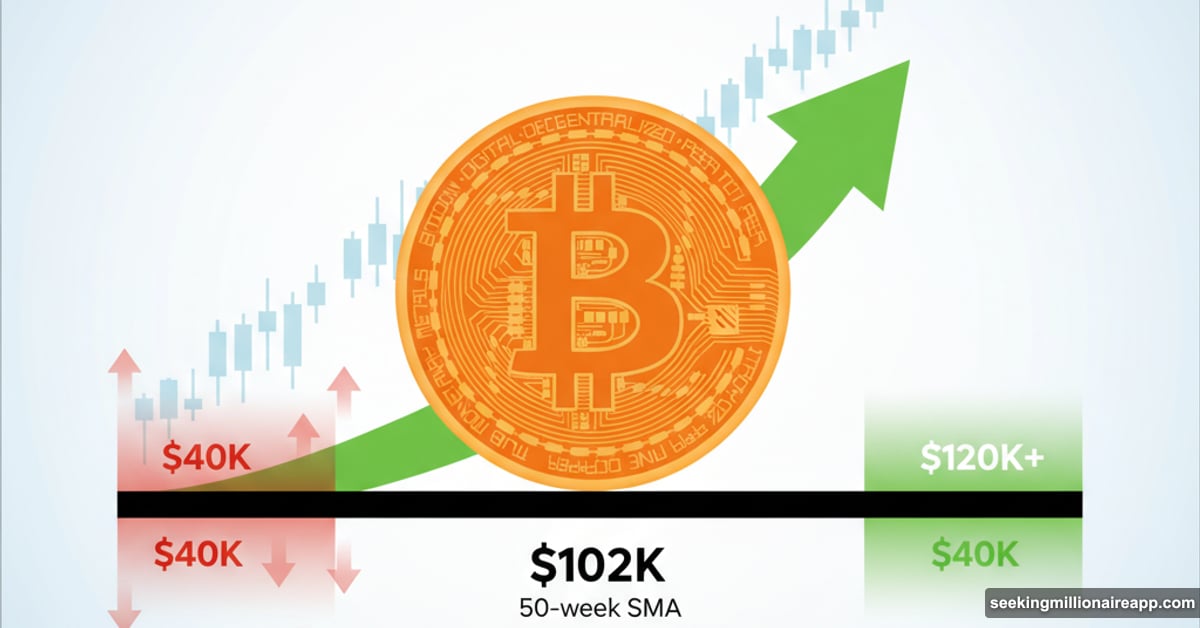
Bitcoin’s uptrend depends on one critical level: the 50-week Simple Moving Average. Right now, that sits around $102,000.
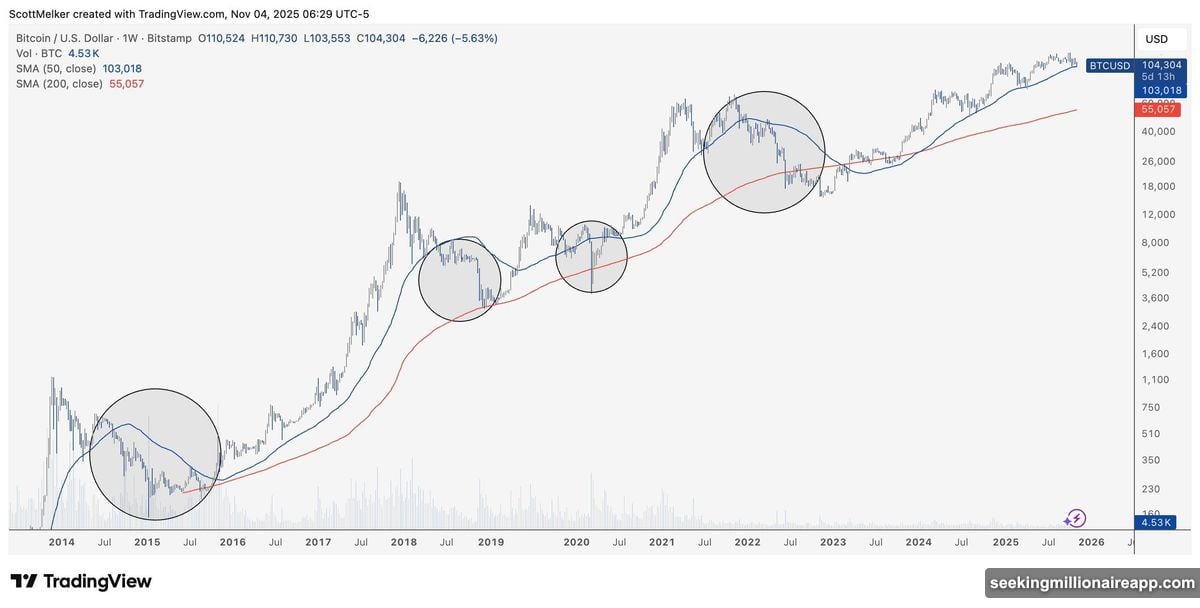
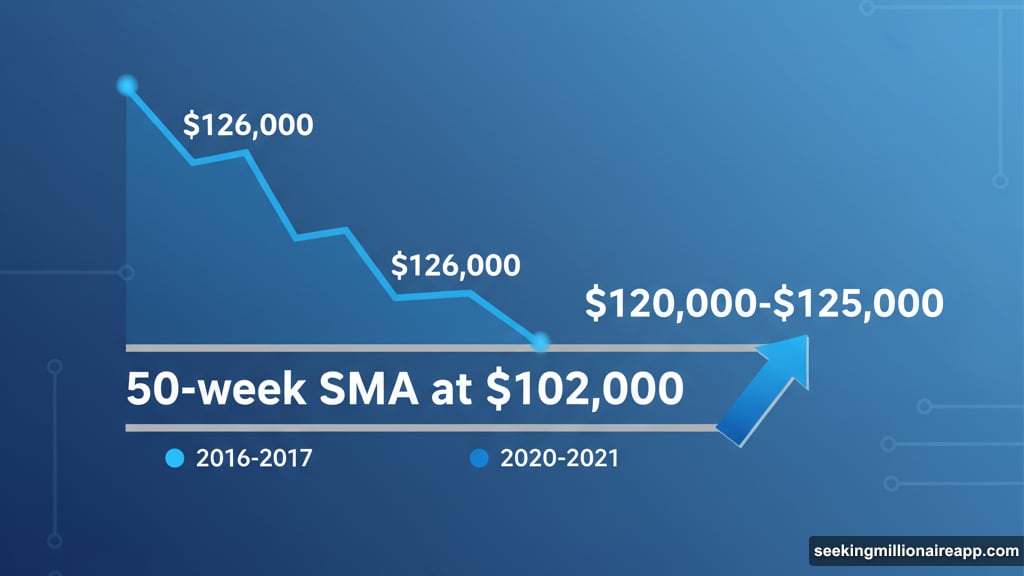
This moving average has separated bull markets from bear markets throughout Bitcoin’s history. Plus, every time BTC has touched this level during previous cycles, it bounced hard. We saw this pattern in 2016-2017 and again in 2020-2021.
Analyst Colin points out that Bitcoin hasn’t closed a weekly candle below this support since the current bull run began in 2023. That’s significant. It means the underlying trend remains intact despite recent volatility.
However, there’s a warning here. Lark Davis calls this level “the line in the sand.” A weekly close below $102,000 could trigger a 60% correction toward $40,000. So far, Bitcoin has defended this zone successfully.
Moving Average Convergence Signals a Bottom
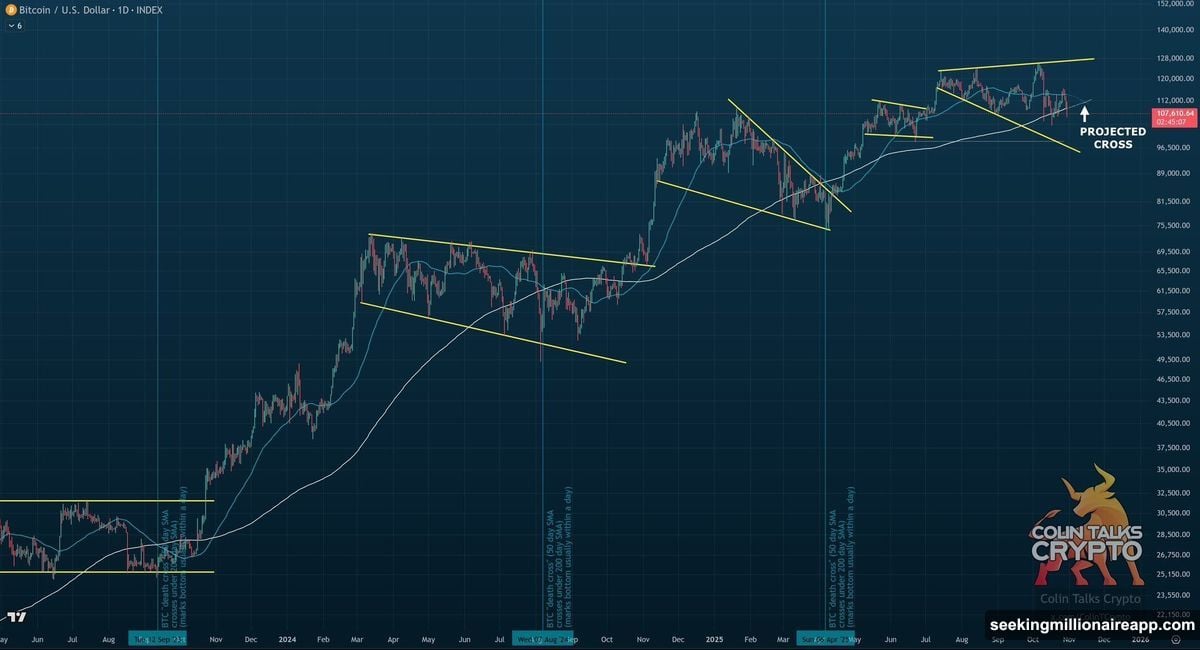
Another technical signal supports the bullish case. The 50-day and 200-day moving averages are projected to intersect around mid-November.
This convergence has historically marked local bottoms. When these two averages cross, it often precedes a strong rebound. We’ve seen this pattern play out multiple times in past cycles.
Moreover, Bitcoin has only lost 50-week SMA support four times in its history: 2014, 2018, 2020, and 2022. Each instance led to extended bear markets. Since Bitcoin hasn’t broken this support yet, the probability favors continuation rather than collapse.
The technical structure suggests caution but not alarm. A solid weekly close above $106,000 would confirm the rebound and potentially set up a retest of $120,000-$125,000.
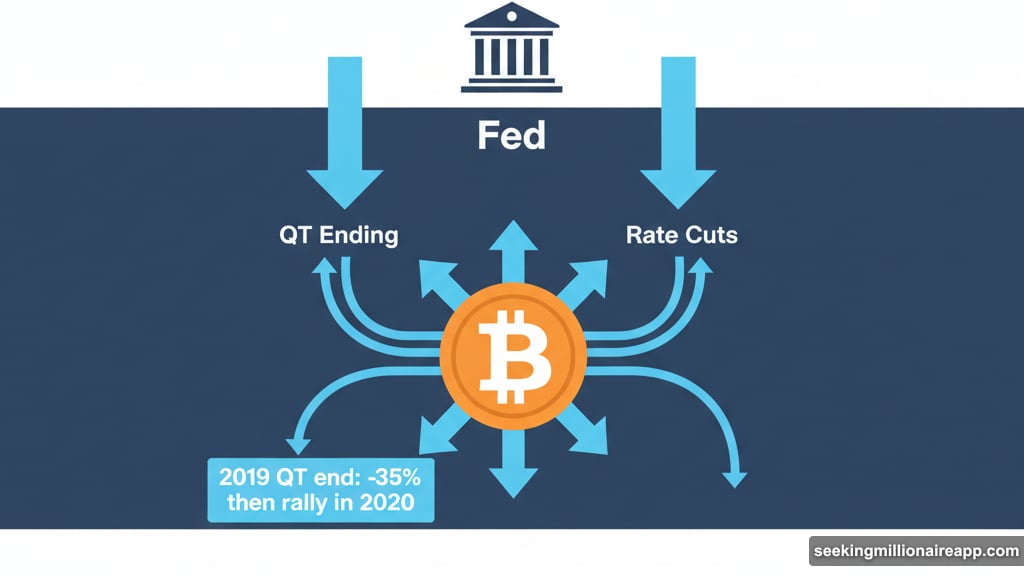
Federal Reserve Policy Shifts Favor Risk Assets
Beyond charts, macroeconomic conditions are lining up for Bitcoin. The Federal Reserve appears ready to end Quantitative Tightening and potentially cut rates.
This matters more than most people realize. When the Fed ended QT in 2019, Bitcoin initially dropped 35% before rallying strongly once Quantitative Easing resumed in early 2020. We could be seeing a similar setup now.
Analyst Momin notes that QT is ending and rate cuts could return within the next few quarters. That shift would inject liquidity back into markets. Risk assets like Bitcoin typically benefit when liquidity expands.
Colin predicts Bitcoin could resume its uptrend by mid-November based on these cyclical indicators. He also expects Bitcoin Dominance to decline over the next 1-3 weeks, which often signals the start of altseason when other cryptocurrencies outperform.
Liquidity Will Drive the Next Phase
History shows that macroeconomic liquidity drives Bitcoin bull markets. The 2020 rally proved this when massive Fed stimulus pushed Bitcoin from $10,000 to $65,000.
If the Federal Reserve pivots toward monetary easing now, Bitcoin could mirror that pattern. However, policy effects take time to materialize. Markets might not react immediately to rate cuts or QT changes.
That lag explains why some investors doubt the bullish thesis. They see slowing ETF inflows and limited immediate liquidity. But monetary policy operates on a delayed timeline. The impact typically appears weeks or months after the policy shift begins.
Meanwhile, Bitcoin’s technical structure remains healthy as long as the 50-week SMA holds. This creates a window where patient investors could benefit from the next leg up while nervous traders exit at cycle lows.
Price Targets Still Point Higher
Analysts aren’t just defending current levels. They’re projecting significantly higher prices ahead.
Colin estimates Bitcoin could reach $140,000-$180,000 in early 2026. That assumes the Federal Reserve follows through with monetary easing and global liquidity expands over the next year.
This projection isn’t random optimism. It’s based on historical cycle patterns and the relationship between liquidity conditions and Bitcoin prices. Previous post-halving cycles have shown similar trajectories when macro conditions support risk assets.
Of course, predictions carry uncertainty. Policy could change. Unexpected shocks could derail the cycle. But the probability distribution currently favors higher prices rather than a premature cycle end.
The key is whether Bitcoin can maintain support above $102,000. That level determines whether we see continuation or correction.
What This Means for Your Strategy
Selling Bitcoin now assumes the bull cycle has ended. The data doesn’t support that conclusion yet.
Technical indicators show intact uptrend structure. Macroeconomic conditions are shifting toward liquidity expansion. Historical patterns suggest rebounds from 50-week SMA support. All three factors point toward continuation rather than collapse.
That doesn’t mean Bitcoin can’t go lower temporarily. Short-term volatility will persist. But closing positions at cycle support levels has historically proven costly for long-term holders.
The smarter approach? Watch for a weekly close below $102,000 as your real warning signal. Until then, the bull trend remains alive despite the recent correction. Patience might reward those who hold through this volatility rather than panic-sell at support.