Bitcoin can’t catch a break right now. After dropping roughly 4% in a single week, the world’s largest cryptocurrency is facing pressure from both geopolitical tensions and shaky macroeconomic conditions. But the more worrying story isn’t happening in the headlines. It’s happening on-chain.
Four separate data indicators are all pointing in the same direction. And none of them look particularly encouraging for short-term bulls.
![A dark-toned digital illustration showing Bitcoin’s price chart overlaid with declining on-chain metric lines, representing weakening market fundamentals and cautious whale activity]
Accumulation Trend Score Slides Toward Zero
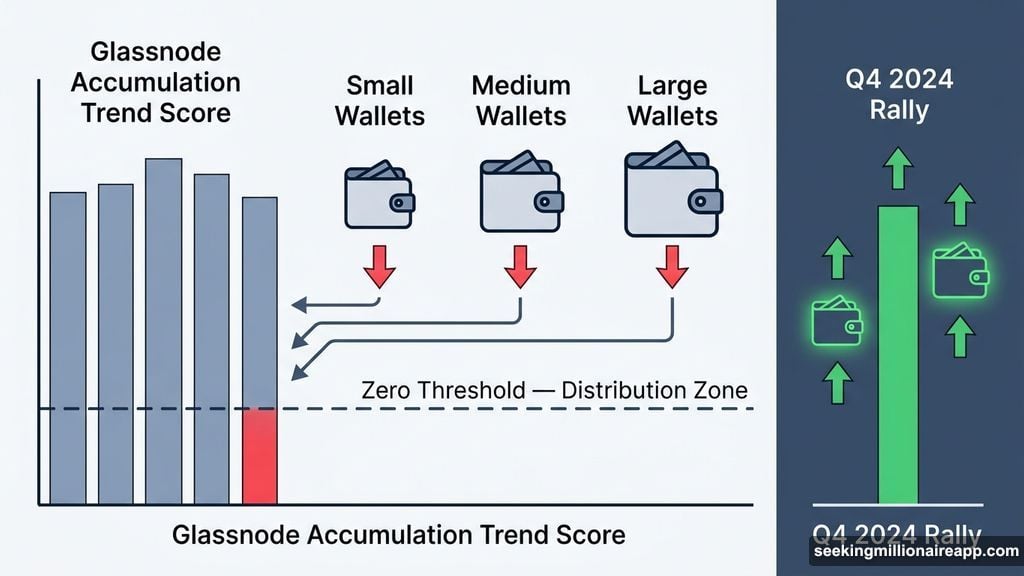
Glassnode’s Accumulation Trend Score is one of the clearest gauges of whether investors are buying or stepping back. Right now, it’s sitting near zero.
That matters because zero doesn’t just mean nobody’s buying. It signals active distribution or broad inactivity across wallet types. In plain terms, holders across the board are either selling or doing nothing.
Glassnode specifically called out small to medium wallets, noting they tend to shift toward distribution during periods of market weakness. Compare that to Q4 2024, when broad accumulation across wallet sizes helped kick off a sustained rally. The firm was direct about what recovery requires: “Heavy participation across wallet sizes remains a precondition for any durable recovery.”
So right now, that precondition simply isn’t being met.
Whale Transfers Hit Lows Not Seen Since 2023
Big money is going quiet. That’s the takeaway from Santiment’s latest data on Bitcoin whale activity.
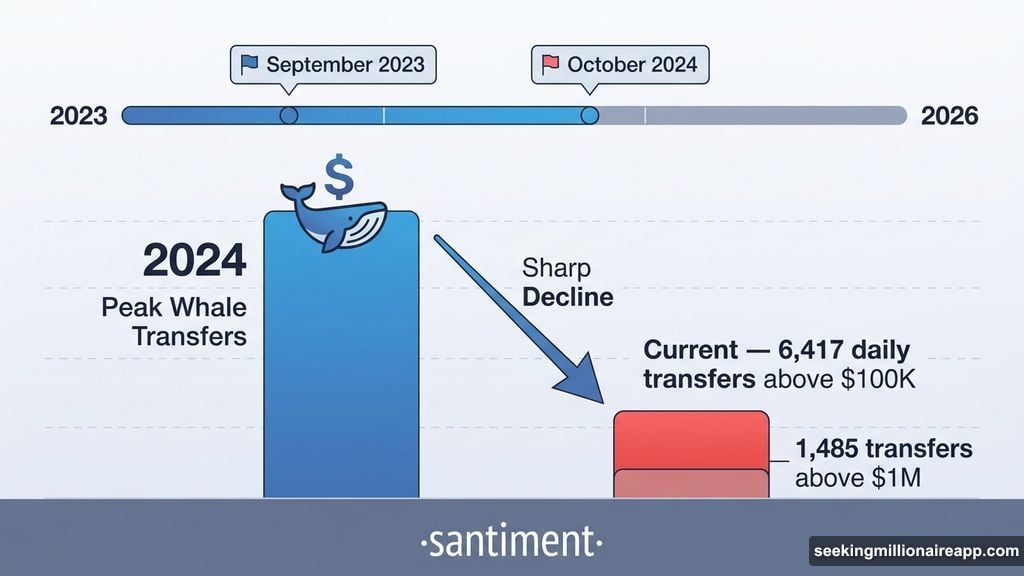
Daily transfers above $100,000 have dropped to just 6,417 in the past week. That’s the lowest reading since September 2023. Meanwhile, transfers exceeding $1 million fell to 1,485, a level not seen since October 2024. Both numbers represent a significant pullback from what analysts typically associate with healthy market participation.
Santiment described the situation bluntly: “Bitcoin’s whale activity has become historically quiet as key stakeholders await clarity from the CLARITY Act, as well as long-term finality to the war.”
Importantly, Santiment didn’t frame this as definitively bearish. Instead, the firm pointed out something more unsettling. Smart money is sitting in the same position as retail investors, reluctant to make a move while policy questions and geopolitical uncertainty remain unresolved. When even the large players won’t commit, it’s hard to build momentum in either direction.
![An infographic-style chart comparing Bitcoin whale transfer volumes across 2023-2026, showing the recent sharp decline to multi-year lows in large transaction activity]
Bitcoin’s Fundamental Index Keeps Declining
Beyond whale behavior, Bitcoin Vector flagged another troubling signal. BTC’s Fundamental Index is in a steady decline.
The firm described current on-chain conditions as “stability without support,” which is a very different thing from healthy consolidation. Healthy consolidation implies underlying strength that’s temporarily pausing. Stability without support means the price is holding up largely because of external flows or short covering, not genuine organic demand.
Bitcoin Vector put it plainly: “As long as on-chain conditions stay weak, upside looks increasingly dependent on flow, short covering, or external catalysts, not organic strength.”
That last part is the critical piece. If fundamentals don’t recover alongside price, the kind of divergence we’re seeing now rarely supports a sustained mid-term recovery. The price can drift higher on momentum, but without on-chain backing, those moves tend to fade.
CryptoQuant’s Network Activity Index Points to Weakening Demand
CryptoQuant analyst Maartunn rounded out the picture by highlighting one more declining metric: the CryptoQuant Network Activity Index.
This index tracks activity levels across the Bitcoin network, including transaction volume, active addresses, and general usage patterns. When it drops, it signals that fewer people are actively using the network. Less usage typically means less demand for BTC as a functional asset, not just a speculative one.
With this index continuing to slide, Maartunn’s read aligns with the broader story all four indicators are telling. Demand is cooling across multiple measurement frameworks simultaneously.
What Would Actually Change the Picture
Four indicators flashing caution doesn’t guarantee Bitcoin falls from here. Markets can and do defy on-chain logic, especially when macro conditions shift quickly.
But it does tell us something specific about what a genuine recovery would need. It wouldn’t just need a price catalyst. It would need broader wallet participation returning, whale activity picking back up, fundamental metrics stabilizing, and network usage growing again. That’s a lot of boxes to check at once.
Right now, the data suggests any rally Bitcoin manages in the short term faces real headwinds. Until the on-chain picture improves, upside moves may continue running into quiet selling pressure rather than fresh accumulation. The smart money isn’t panicking. But it isn’t buying either. And in crypto markets, that kind of paralysis tends to favor the path of least resistance downward.