BitMine’s stock is bouncing. BMNR climbed 6% on February 13 and added another 7.32% over the five days that followed. But here’s the thing — that recovery might not be as strong as it looks.
Ethereum dropped 3.3% during the same stretch. BitMine holds ETH as a treasury asset, so its price usually moves in lockstep with crypto markets. The fact that BMNR rose while ETH fell suggests the stock is playing catch-up rather than building real momentum. And beneath that bounce, some warning signs are flashing hard.
A Bear Flag Pattern Still Threatens a 60% Drop
BitMine’s chart tells a story that cautious investors should read carefully.
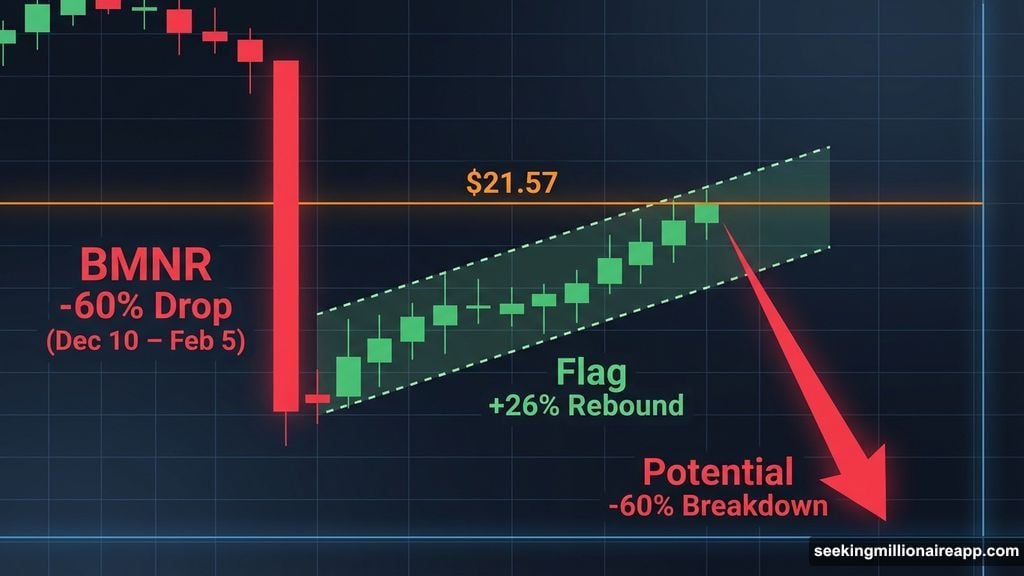
Between December 10, 2025, and February 5, 2026, BMNR fell nearly 60%. That steep plunge created what traders call the “pole” of a bear flag — a sharp drop followed by a gentle drift upward. Since February 5, the stock has recovered about 26%, forming the “flag” portion of the pattern.
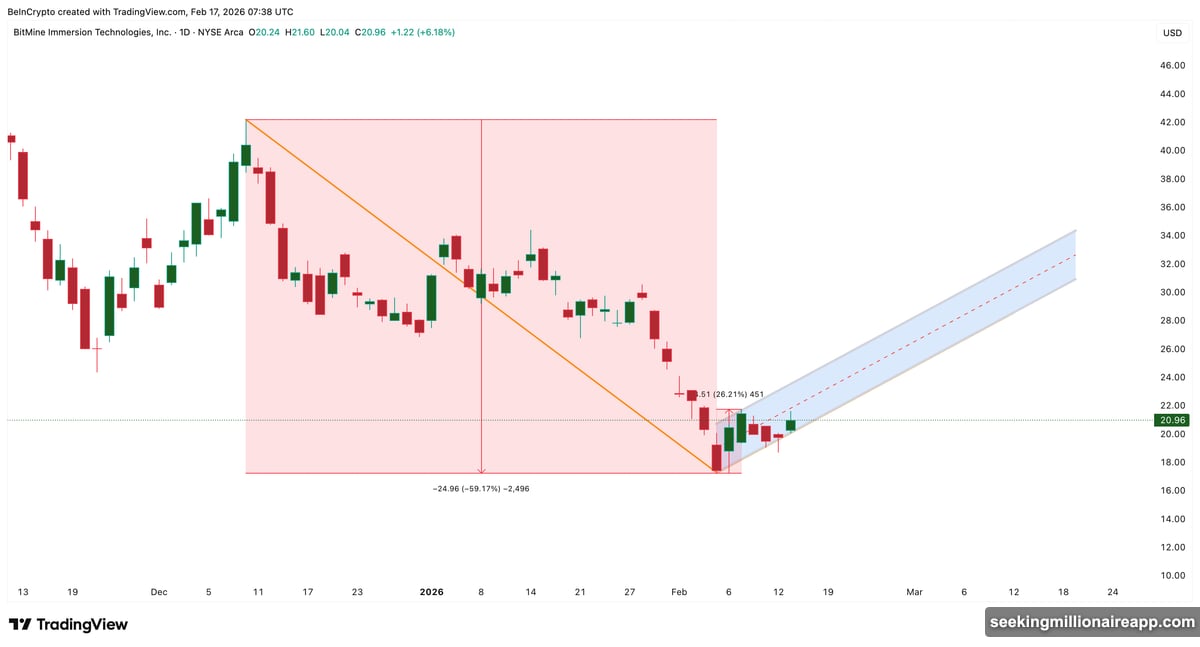
So what’s the problem? That recovery is still happening inside the bearish structure. Think of a bear flag like a rubber band pulled down hard and then slightly released. The partial snap back doesn’t mean the tension is gone. Unless buyers push the price above key resistance levels, this rebound could simply be a brief pause before another leg lower.
If the bear flag confirms a breakdown, BMNR could fall another 60% from the lower trendline breach point. That’s a significant risk sitting right under what looks like a promising recovery.
![BitMine BMNR stock chart showing bear flag pattern with resistance levels and potential breakdown zones on TradingView]
Hidden RSI Divergence Points to Sellers Still in Charge
Momentum indicators are adding to the concern. The Relative Strength Index, or RSI, measures buying and selling strength on a scale from 0 to 100. When RSI rises while the price struggles, it can actually signal weakening buyer conviction — not strength.
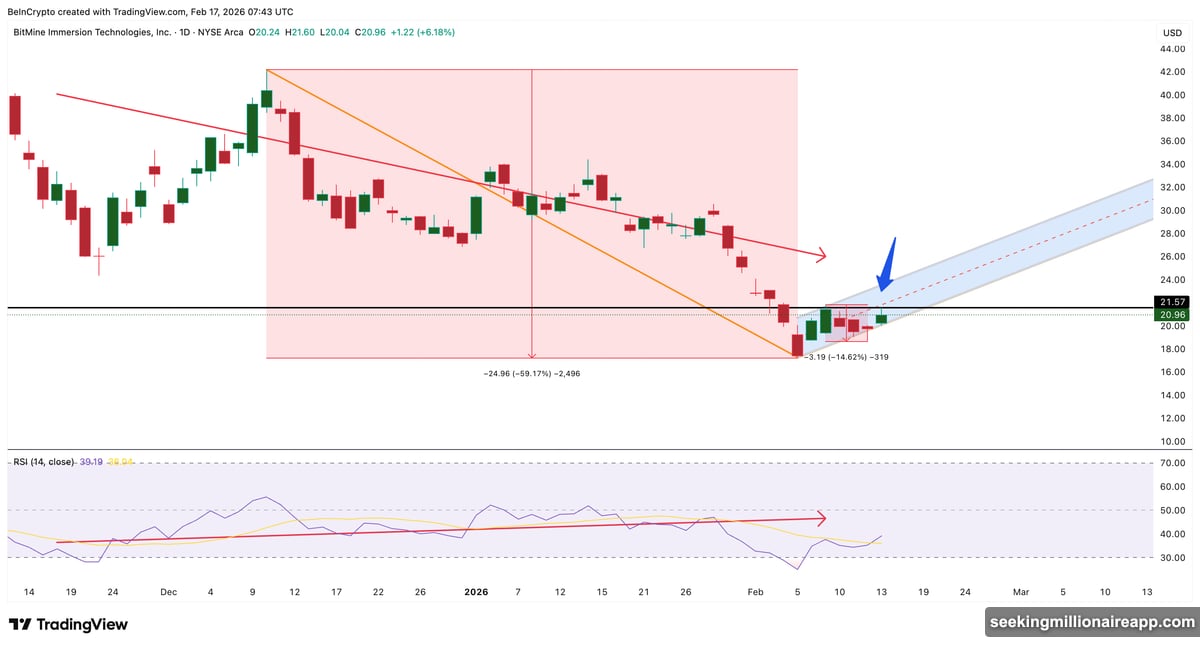
Between November 18, 2025, and February 9, 2026, BitMine formed what analysts call a hidden bearish divergence. The price made a lower high, but RSI made a higher high. That kind of mismatch typically means sellers still hold control, even as the stock ticks upward. After this divergence appeared, BMNR dropped more than 14%.
Now, a similar setup is potentially forming again. RSI has started climbing, but the price still sits below key resistance near $21.57. If BMNR can’t push through that level, another bearish divergence could form and confirm a breakdown. So the momentum picture remains murky at best.
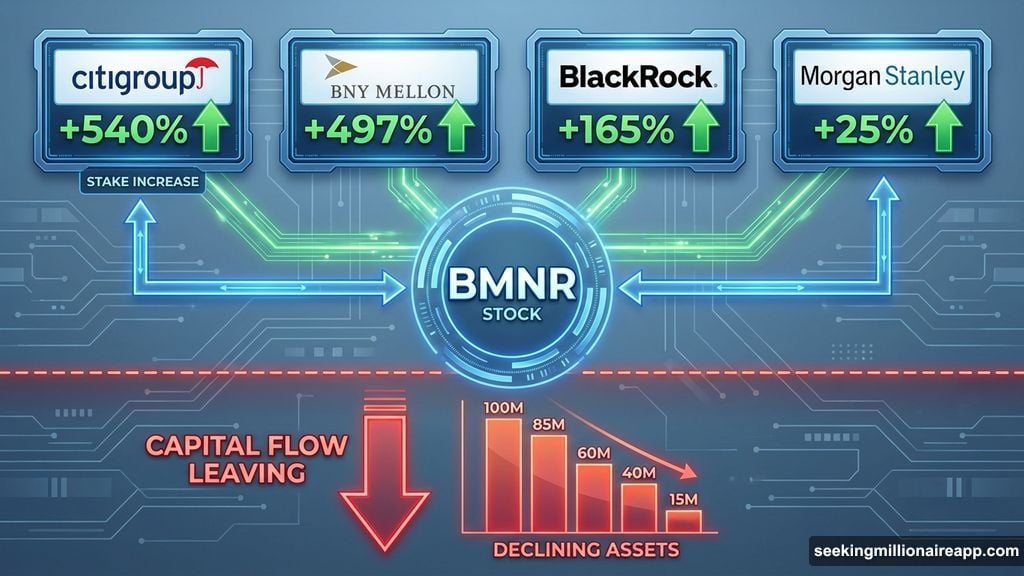
Citigroup Bought 540% More — But Capital Flow Is Still Leaving
Here’s where things get genuinely interesting. On the institutional side, some very large names have been loading up on BMNR.
Citigroup increased its ownership stake by over 540% in the most recent quarter. BlackRock raised its exposure by 165%. BNY Mellon expanded by 497%. Morgan Stanley added 25%. That kind of institutional accumulation normally signals serious confidence in a stock’s future.
But not everyone is buying. Firms like Baird Financial and Resources Investment Advisors have been selling their positions. And when you look at the broader capital flow picture, the data still leans negative.
The Chaikin Money Flow indicator, or CMF, tracks whether large investors are putting money into or pulling money out of an asset. A reading below zero means capital is still leaving overall. BitMine’s CMF has started rising gradually, which shows that selling pressure is easing. But it hasn’t crossed above zero yet. That means total institutional buying hasn’t reversed the broader outflow trend.
So you have some major players adding aggressively while others exit, and the net result is a market still leaning toward selling. That conflict explains why the stock’s recovery keeps stalling.
![BitMine BMNR Chaikin Money Flow indicator showing capital outflow trend with gradual improvement but still below zero line]
The Key Levels That Will Decide Everything
BitMine’s next move hinges on two specific price zones.
On the upside, BMNR needs to clear resistance between $21.57 and $21.74. Breaking through that range would weaken the bearish structure and open the door to $29.60, and potentially $34.03, assuming Ethereum also gains some ground. That scenario would confirm buyers are genuinely back in control.
On the downside, $20.02 is the line in the sand. If BMNR drops below that support level, the bear flag breakdown could begin in earnest. From there, the stock could slide toward $15.05, then $11.22, and in a worst-case scenario all the way down to $8.36.
Right now, BMNR sits right in the middle of those two outcomes. Institutional giants like Citigroup are clearly betting on the upside. But bearish chart structure, hidden RSI divergence, and still-negative capital flows all suggest the recovery hasn’t earned its credibility yet.
The next few trading sessions will likely settle the debate. Either buyers push above resistance and validate the rebound, or the bear flag does what bear flags usually do.