
The crypto market is hurting today. Total market cap has slipped to $2.32 trillion, and sellers are firmly in the driver’s seat after a punishing five-day slide from $2.5 trillion.
So what’s actually going on? A mix of macro pressure and technical breakdowns tells the story. Let’s walk through what the charts are showing across Bitcoin and Skycoin right now.
Macro Shockwaves Hit Asian Markets Hard
Before diving into crypto charts, it helps to understand the bigger picture hitting markets today.
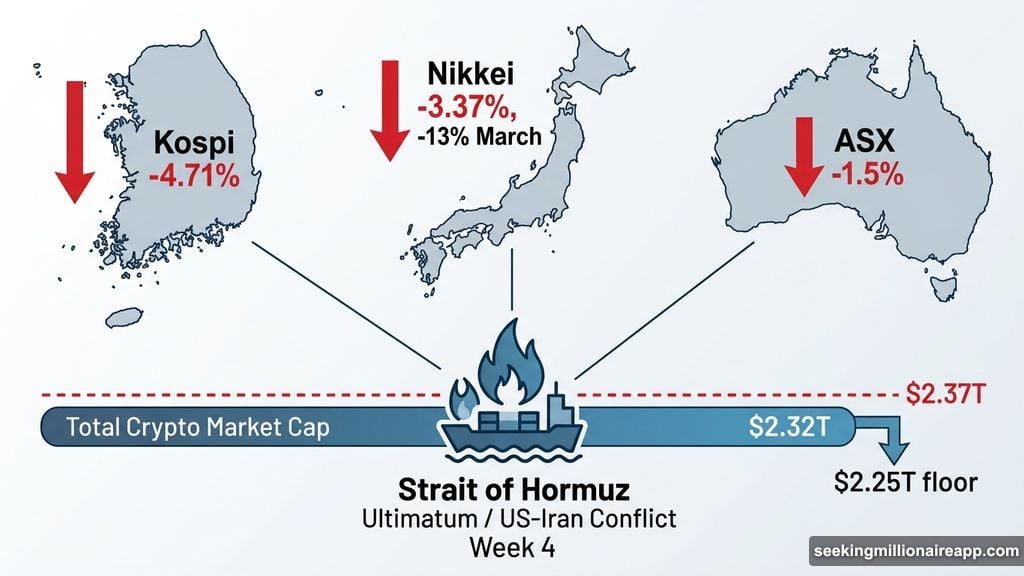
Asian stocks took a serious hit on Monday. South Korea’s Kospi dropped 4.71%. Japan’s Nikkei shed another 3.37%, pushing its total March loss past 13%. Australia’s ASX fell 1.5% too.
Why the carnage? The US-Iran conflict entered its fourth week, and a Strait of Hormuz ultimatum rattled energy and inflation outlooks across the region. That kind of geopolitical shock ripples fast through risk assets. And crypto is about as “risk-on” as it gets.
On a slightly different note, NYSE Arca and NYSE American both filed SEC rule changes to remove position and exercise limits on options tied to spot Bitcoin and Ether ETFs. The SEC waived the standard 30-day waiting period, making changes effective immediately. That’s actually a quiet win for crypto infrastructure, even if the market isn’t celebrating right now.
Total Crypto Market Cap Stalls Below $2.37 Trillion Resistance
Here’s the key number to watch: $2.37 trillion.
That level held as solid support through mid-March. Now it’s flipped to resistance. The total market cap has closed at $2.32 trillion for two consecutive sessions without managing a recovery close above that line. That kind of failed recovery tells you sellers are still in control.
The daily range on March 23 ran from a low of $2.3 trillion to a high of $2.34 trillion, with the annotated candle showing a $23.09 billion loss of 1.02%. Two sessions testing the same $2.32 trillion support without a bounce above $2.37 trillion is not a good sign.
If the market can’t reclaim $2.37 trillion on a daily close, the next visible floor sits at $2.25 trillion. That’s a meaningful drop from here. On the flip side, a strong daily close back above $2.37 trillion would neutralize the bearish pressure and put $2.45 trillion back on the table. That level capped price on March 20 before this latest leg lower.
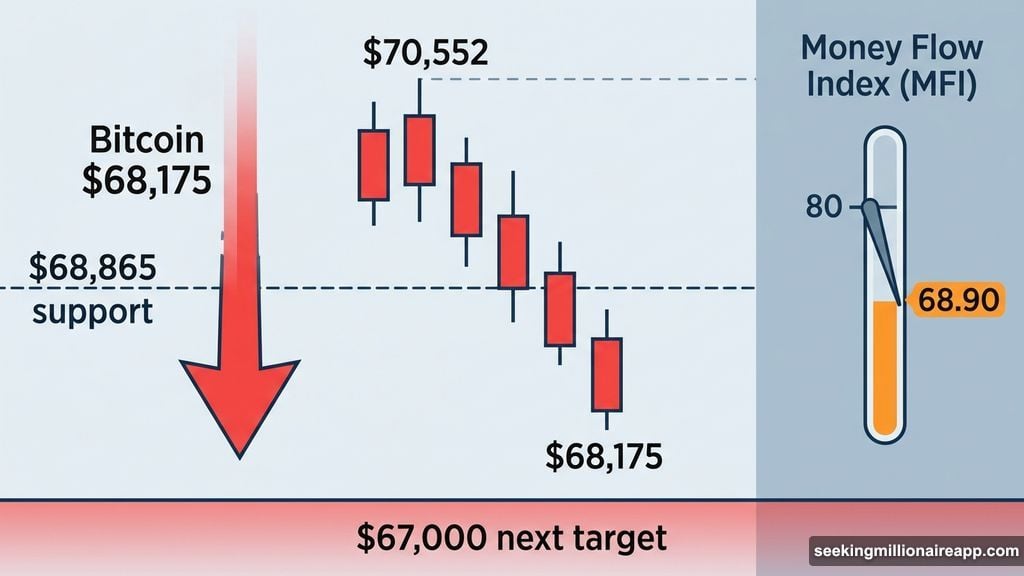
Bitcoin Price Analysis: Breaking Below $68,865
Bitcoin is trading around $68,175 as of March 23, down from recent highs and sitting below the $68,865 support level for the first time since early March.
That’s not a great look. Bitcoin had already failed to hold $70,552 earlier in the week. Now it’s losing the next key floor too. The Money Flow Index (MFI) tells the same story, dropping from a recent peak near 80 down to 68.90. That declining MFI while price loses horizontal support confirms that buying pressure is fading, not building.
The next downside target is $65,776. Below that, $64,043 becomes the secondary floor if selling accelerates further.
For bulls to regain control, Bitcoin needs a daily close back above $68,865. That would neutralize the immediate bearish setup and bring $70,552 back into focus. But until that happens, $68,865 acts as overhead resistance, and the path of least resistance points lower.
Skycoin Fibonacci Support Crumbles
Skycoin (SKY) is having a rough session, down 3.25% to $0.0685 with a session loss marked at 9.08%.
The technical damage here is notable. SKY has broken below two key support levels at the same time: the 0.618 Fibonacci level at $0.0704 and the 50-day exponential moving average (EMA) also sitting at $0.0701. Both held through last week. Both gave way today.
When price breaks below a Fibonacci support level and the moving average flips to resistance in the same session, it’s a clear signal that momentum has shifted bearish. The 0.382 Fibonacci level at $0.0668 is the next support below. A close under that would expose the 0.236 level at $0.0646, with the base level at $0.0611 visible further below.
Recovery is possible but requires a specific trigger. SKY needs to reclaim both the EMA and $0.0704 on a daily close to invalidate the bearish thesis. That would put the 0.786 Fibonacci level at $0.0720 back in play as the next resistance overhead. Without that reclaim, $0.0668 is the next stop.
What This All Means Right Now
The crypto market is dealing with a convergence of pressure points. Macro stress from geopolitical uncertainty is pushing risk assets lower globally. Meanwhile, Bitcoin and altcoins are breaking through technical supports that had held for weeks.
None of this necessarily means a prolonged crash is coming. Markets test supports and recover all the time. But the pattern here, two consecutive sessions failing to reclaim $2.37 trillion in total market cap, Bitcoin losing $68,865, and SKY breaking Fibonacci support, paints a bearish short-term picture.
The levels to watch are clear. For the broader market, $2.37 trillion is the line bulls need to reclaim. For Bitcoin, it’s $68,865. Until those close above those levels on a daily basis, sellers are still running the show.
Stay patient, watch the daily closes, and don’t let short-term noise push you into decisions you’ll regret.