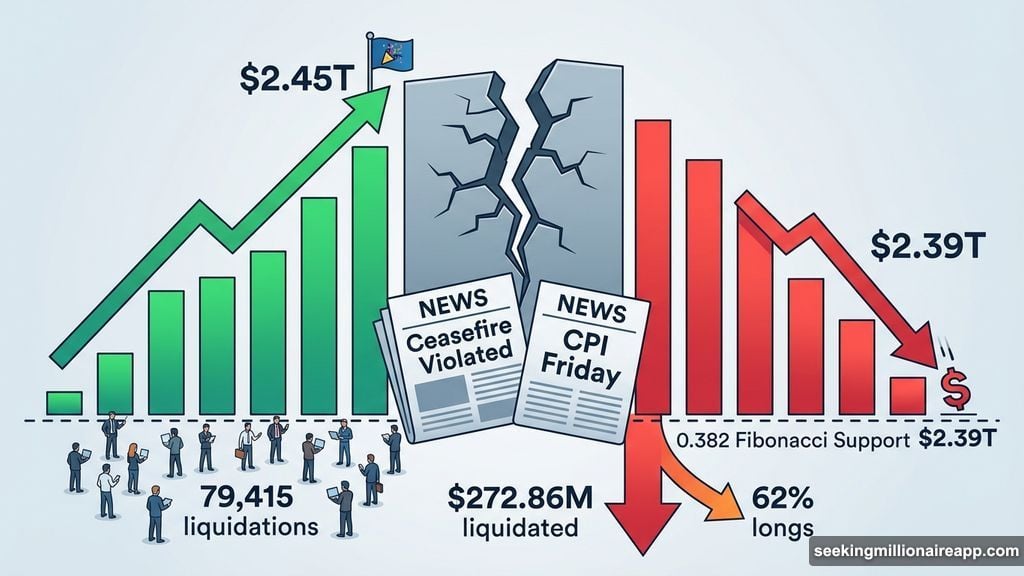
The crypto market was riding high at $2.45 trillion on April 8. Then reality hit.
By April 9, that figure had slipped to $2.39 trillion — a $21.12 billion fade driven by ceasefire violations in the Middle East, fresh inflation anxiety ahead of Friday’s CPI report, and money flowing toward equities instead of digital assets. Bitcoin dipped to $71,023, and World Liberty Financial (WLFI) became one of the session’s most dramatic stories, tumbling over 13% after its own treasury essentially drained a lending pool dry.
Let’s walk through what happened and what it means.
Ceasefire Euphoria Didn’t Last Long
The rally that pushed crypto toward $2.45 trillion was largely built on ceasefire optimism. But that optimism started cracking fast. Gulf nations reported attacks on day one of the truce, and Iran kept pushing conditions for Strait of Hormuz transit. The risk-on mood that lifted crypto just 24 hours earlier evaporated almost immediately.
Capital rotation made things worse. Equities climbed on the ceasefire headlines while crypto pulled back — a pattern that’s repeated itself throughout the Iran conflict. Both asset classes have struggled to rally at the same time, and April 9 was no exception.
Liquidations piled up quickly. Total 24-hour liquidations across 79,415 traders hit $272.86 million, with long positions accounting for $170.42 million of that — roughly 62% of all forced exits.
Friday’s CPI Report Adds Pressure

Beyond the geopolitical noise, traders are bracing for March CPI data due Friday. A hotter-than-expected inflation reading would push rate-cut expectations further out, tightening the liquidity environment that speculative assets like crypto depend on.
From a technical standpoint, the market currently sits on the 0.382 Fibonacci level at $2.39 trillion. That’s the immediate floor. A break below that opens the door to $2.33 trillion at the 0.236 level. On the upside, $2.44 to $2.45 trillion needs to be reclaimed before the real test — $2.49 trillion at the 0.618 level. A clean move above that would point toward $2.56 trillion and eventually $2.65 trillion.
If $2.39 trillion holds, dip buyers may make another run at $2.45 trillion. If it breaks, the $2.33 trillion zone becomes the next battleground.
Bitcoin’s Cup and Handle Pattern Still Points to $81,000
Bitcoin’s slide to $71,023 sounds alarming on the surface. But zoom out to the daily chart and the picture looks more interesting than the headlines suggest.
Since late March, BTC has been quietly forming a cup and handle pattern. Think of it like a teacup shape — a rounded bottom formed through late March, followed by a short consolidation that acts as the handle. The pattern carries an 11.46% breakout projection from the neckline, pointing toward the $81,000 zone.
Here’s what Bitcoin needs to trigger that move. First, a daily close above $71,673 breaks out of the handle. Then, a close above $73,272 — the 0.618 Fibonacci resistance level — would crack the cup’s neckline and set up the run toward $81,000.
Importantly, the intraday pullback doesn’t break the pattern. Handles routinely dip before breakout attempts, and the current decline keeps price well within the structure’s boundaries. The ceasefire uncertainty and CPI overhang might stretch the handle longer, but they don’t invalidate it.
On the downside, $70,074 is the first support to watch. A drop below $68,096 weakens the handle. And a breakdown below $64,899 — the cup’s base — would cancel the pattern entirely.
So the setup is still alive. But patience is required.
WLFI Drops 13% After Draining Its Own Lending Pool
World Liberty Financial had a rough session that went beyond the market-wide pullback. WLFI fell 13.42% since April 7 to trade at $0.0916, and the trigger was specific and unusual.
On April 8, WLFI’s own strategic reserve wallet deposited roughly 3 billion WLFI governance tokens as collateral on Dolomite — a decentralized lending protocol. The wallet then borrowed $50.44 million in USD1, the project’s dollar-pegged stablecoin. That single move pushed pool utilization past 100%, leaving available liquidity at negative 232,000 tokens.
The fallout was immediate. USD1 deposit rates surged to 35.81% and borrowing costs hit 30%. Those elevated yields attract lenders chasing returns, but they come with a serious risk attached. If WLFI’s token price keeps falling, the over-collateralized position faces liquidation. That cascade could trap yield-chasing lenders in a pool with no exit.
The technical setup had already been flashing warning signs before this happened. WLFI has been trading inside a falling channel since mid-February. Between February 18 and April 7, price made a lower high while the RSI — a momentum indicator — made a higher high. That combination is known as hidden bearish divergence, a signal that typically confirms the existing downtrend rather than reversing it. The signal proved accurate.
For WLFI to stabilize, it needs to hold $0.090 at the 0.382 Fibonacci level. A break below that opens a path toward $0.080 and then $0.073. Dropping below $0.073 would expose the lower boundary of the falling channel. Recovery only begins to look credible if WLFI reclaims $0.096, with a move back above $0.106 needed to shift the short-term trend toward neutral.
Morgan Stanley Enters the Bitcoin ETF Arena
Amid the market turbulence, Morgan Stanley launched its spot Bitcoin ETF — ticker MSBT — on NYSE Arca. The fund carries a 0.14% expense ratio, making it the cheapest spot Bitcoin ETF currently available.
ETF analyst Eric Balchunas projected $5 billion in assets under management within the first year and roughly $30 million in day-one trading volume. That’s an optimistic forecast, but it’s worth noting the context. The spot Bitcoin ETF market saw $6.3 billion in net outflows between November and February, so MSBT enters a competitive and somewhat cautious environment.
Still, the arrival of Morgan Stanley’s offering signals continued institutional appetite for regulated Bitcoin exposure, even during a market downturn.
Ethereum Foundation Keeps Selling ETH
The Ethereum Foundation continued its pattern of converting ETH to stablecoins, selling 3,750 ETH worth $8.3 million at an average price of $2,214 via CoW Protocol — a decentralized trading platform. The Foundation still holds 1,250 ETH, worth approximately $2.77 million, earmarked for grants and ongoing donations.
These sales have drawn scrutiny from parts of the Ethereum community in recent months, though the Foundation has framed them as necessary for operational funding.
Right now, the crypto market is navigating a narrow path. Geopolitical uncertainty, inflation data on the horizon, and isolated project-level crises like WLFI’s lending pool drama are keeping sentiment cautious. But Bitcoin’s cup and handle structure is still intact, and the $2.39 trillion support level hasn’t cracked yet.
Whether dip buyers step in or the pressure builds from here likely depends on two things: what Friday’s CPI print says, and whether the ceasefire holds long enough to restore some risk appetite. Neither answer is clear yet — and that uncertainty is exactly why the market is sitting still and watching.