The crypto market didn’t like what it heard Wednesday night. After President Trump’s prime-time address on Iran failed to offer any real de-escalation, traders hit the exit fast.
Total market cap fell to $2.28 trillion on April 2, shedding 1.8% in a single session. Bitcoin slipped close to 2%, Rain (RAIN) cratered 7% on the day, and over $217 million in long positions got wiped out. This wasn’t a random dip. Several things broke down at once.
Trump’s Iran Speech Triggered the Sell-Off
Markets had positioned for good news. They didn’t get it.
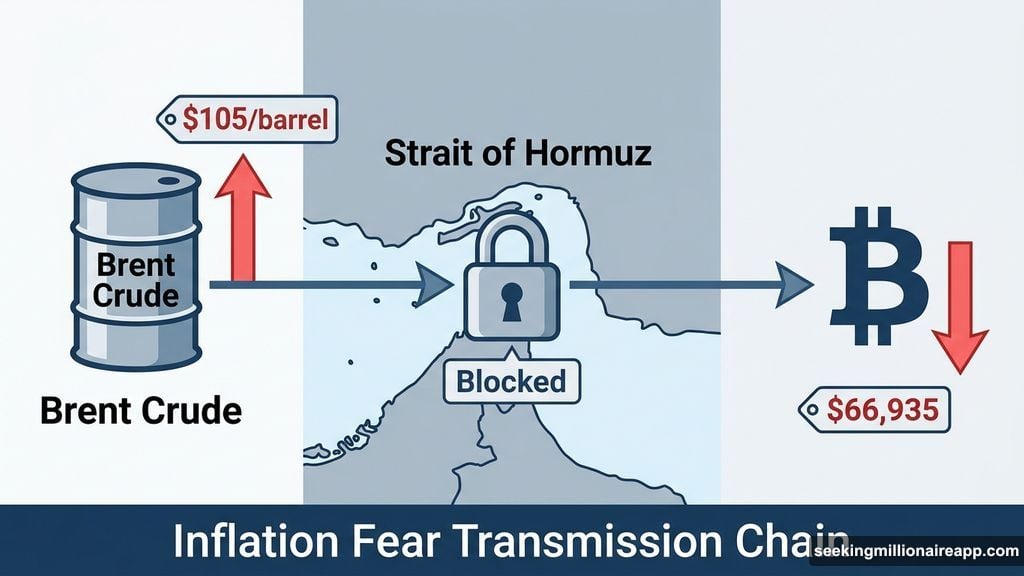
Trump said US forces would “finish the job” in Iran within two to three weeks. But he gave no concrete plan to reopen the Strait of Hormuz, which is the critical shipping lane that energy markets have been watching closely. Without that, oil traders panicked.
Brent crude surged past $105 per barrel almost immediately. That’s a big deal for crypto. When oil spikes, inflation fears rise. When inflation fears rise, appetite for speculative assets like Bitcoin falls. So the oil surge directly pressured crypto.
Meanwhile, Iran’s parliament kept moving forward with legislation to make its yuan-based toll system at the Strait permanent. That’s another signal that the Hormuz situation isn’t getting resolved quickly.
![A digital financial dashboard displaying crypto market cap decline, Bitcoin price chart with head-and-shoulders pattern, and oil price surge indicators on April 2, 2026]
$217 Million in Liquidations Made Things Worse
When prices drop fast, leveraged traders feel it hardest. And on April 2, they felt it badly.
CoinGlass data shows $217 million in long positions were liquidated over 24 hours. Bitcoin and Ethereum alone accounted for nearly $192 million of that combined. These forced sell-offs happen when traders borrow money to bet on price increases and the market moves against them.
The total crypto market cap had already struggled to reclaim the $2.33 trillion resistance level in recent sessions. That failure set the stage for the drop. Now, $2.23 trillion stands as the key support level. Losing that could push the market into a deeper correction.
To flip the situation back to bullish, the total market cap needs a daily close above $2.49 trillion. That’s a significant climb from where things sit right now.
Bitcoin’s Head-and-Shoulders Pattern Is Getting Scary
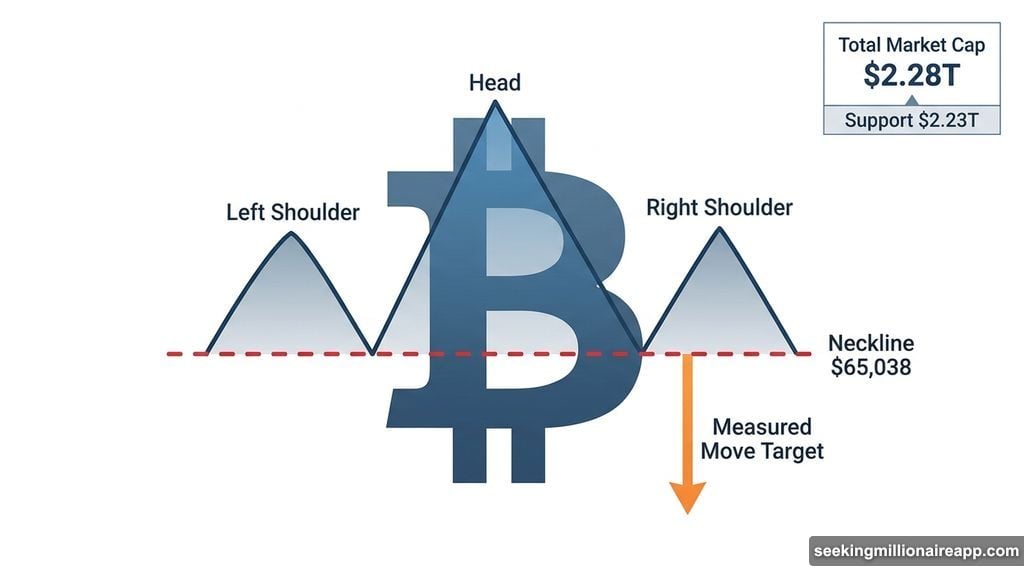
Bitcoin traded at $66,935 on April 2, down almost 2%. But the price number isn’t the scariest part. The chart pattern forming behind it is.
Since early March, Bitcoin has been building what technical analysts call a head-and-shoulders pattern. Think of it like a mountain range with three peaks, where the middle peak is tallest. When prices break below the “neckline” connecting the two valleys between those peaks, it typically signals a significant drop ahead.
Bitcoin’s neckline sits at $65,038. A daily close below that level could trigger a measured move of about 14%, targeting $55,474. There’s some intermediate support at the 0.618 Fibonacci level around $62,386, but that’s cold comfort if the breakdown accelerates.
For the bears to be stopped, Bitcoin needs a daily close above $69,330. A full invalidation of the bearish structure would require reclaiming $76,090. That’s a big ask given the current environment.
Bitcoin Miner Selling Added Supply-Side Pressure
On top of the macro headwinds, Bitcoin miners chose this week to offload holdings. Riot Platforms, one of the largest US Bitcoin miners, sold 500 BTC worth approximately $34.13 million. Separately, BTC reserve company Empery Digital transferred 1,795 BTC worth about $122.5 million to Gemini in what looks like pre-sale positioning.
That’s nearly 2,300 BTC hitting the market during an already fragile stretch. Combined with the failed de-escalation narrative from Trump’s speech, these supply-side flows are pushing Bitcoin toward the neckline faster than the technical pattern alone would suggest.
Drift Protocol Hack Hit Solana and DRIFT Token
Beyond the macro story, one crypto-specific shock rattled the market on April 2.
Solana decentralized exchange Drift Protocol was reportedly hacked after Helius CEO Mert Mumtaz flagged a “high likelihood of a potentially large exploit.” The DRIFT token dropped approximately 17% within an hour as the situation developed. Hacks like this ripple through sentiment broadly, reminding traders that smart contract risk never fully goes away.
![A candlestick chart showing Bitcoin’s head-and-shoulders pattern with neckline at $65,038 alongside Rain (RAIN) falling channel pattern on 8-hour timeframe]
Rain (RAIN) Is the Biggest Altcoin Loser Right Now
Among altcoins, Rain took the hardest hit. RAIN traded at $0.00756 on April 2, down 7% on the day and 17% over the past 30 days. For a token ranked inside the top 30, that’s a brutal stretch.
The 8-hour chart tells a clear story. Rain has been trapped inside a falling price channel since mid-March. On March 30, it broke below all key Exponential Moving Averages, or EMAs, which are trend indicators that weight recent price action more heavily. The 20-period EMA sits at $0.00808 and the 50-period at $0.00840. Both are well above where RAIN trades now.
History adds a warning. The last time RAIN lost the 20-period EMA, it corrected by roughly 20%. A similar drop from current levels would push it toward the lower trendline of the falling channel, near $0.00675. The nearest support before that sits at the 0.618 technical level around $0.00741.
For RAIN to recover, it needs to reclaim $0.00808 first, then $0.00840 to clear the EMA cluster. A push above $0.00878 would also reclaim the 100-period EMA and potentially signal an exit from the bearish structure. But none of that looks imminent given where the broader market sits.
What to Watch Next
Right now, two numbers matter most for crypto traders. For Bitcoin, it’s the $65,038 neckline. A daily close below that opens the door to $55,474. For the total market cap, it’s the $2.23 trillion support. Losing that level likely drags prices significantly lower.
Neither of these situations is guaranteed to play out badly. But the conditions that created Wednesday’s drop, namely geopolitical uncertainty, rising oil prices, miner selling, and leveraged liquidations, haven’t gone away. Until Trump’s Iran policy produces a concrete mechanism for stabilizing the Strait of Hormuz, energy-driven inflation fears will keep a lid on risk appetite.
Watch the daily closes carefully. The difference between a contained pullback and a serious breakdown could be just a few hundred dollars on the Bitcoin chart.