
The crypto market is stuck. Not crashing, not rallying — just sitting there, absorbing pressure from a world that suddenly wants nothing to do with risky assets.
As of March 25, the total crypto market cap sits at $2.40 trillion, up a barely-there 0.12%. Bitcoin is holding ground near $70,644, but the momentum that carried it from February lows is running out of steam. And smaller coins like Decred are feeling the squeeze even harder.
So what’s keeping the market pinned? A mix of geopolitical tension, exhausted buying pressure, and a market that can’t quite decide which direction it wants to go.
US-Iran War Chills Speculative Appetite
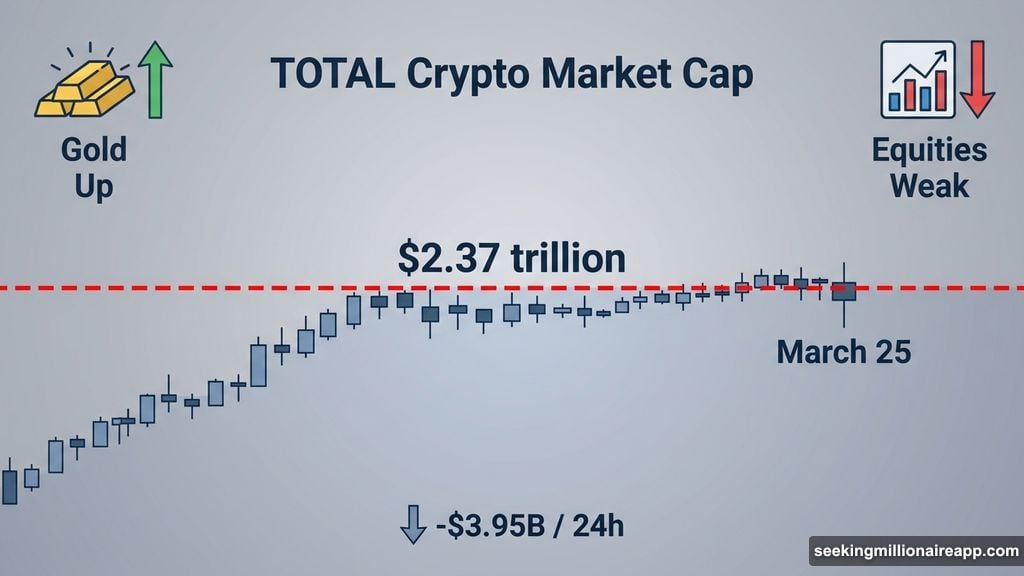
Four weeks into the US-Iran conflict, risk-off sentiment is firmly in charge. Capital that might otherwise flow into crypto is parking itself in safe-haven assets instead. Gold is up. Equities are weak. And institutional investors aren’t exactly rushing to buy speculative tokens right now.
The total market cap has been hovering around $2.37 trillion all week. Over the last 24 hours alone, TOTAL shed roughly $3.95 billion. March 25 is printing what traders call a near-flat candle — basically the chart’s way of saying “nobody’s making any bold moves right now.”
That $2.37 trillion floor is the critical number to watch. If the market closes below it, the current stall stops looking like a pause and starts looking like the beginning of something worse.
Meanwhile, two notable news items added color to the day. Ireland’s Criminal Assets Bureau, working alongside Europol, moved 500 BTC worth approximately $35 million on-chain after seizing a wallet tied to convicted cannabis grower Clifton Collins. Collins, a Dublin security guard turned drug cultivator, had accumulated around 6,000 BTC between 2011 and 2012 at single-digit prices — and the wallet had sat dormant since 2017. And separately, Ark Invest snapped up 161,513 Circle Internet Group shares worth $16.34 million across three of its ETFs, deliberately buying into a 20% single-session drop that brought Circle’s stock down to $101.17.
![Aerial view of a frozen cryptocurrency price chart with geopolitical conflict imagery overlaid, representing market stagnation during the US-Iran conflict]
Bitcoin’s Money Flow Index Hits a Warning Zone
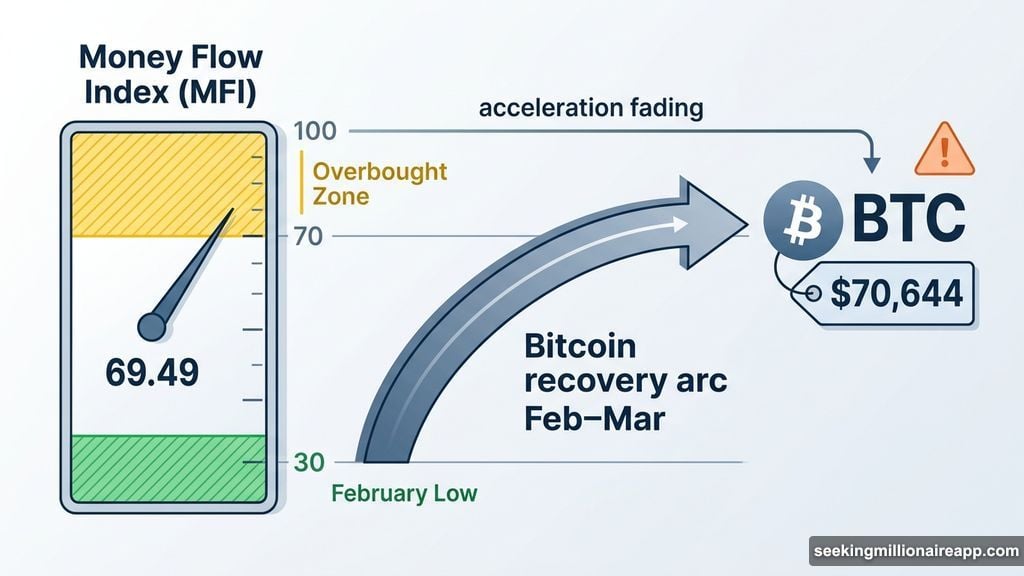
Bitcoin is holding at $70,644, but the technical picture tells a more complicated story.
The Money Flow Index (MFI) — a tool that tracks how much capital is actually flowing into or out of an asset — now reads 69.49. That matters because 70 is historically where overbought conditions begin. Bitcoin climbed steadily from an MFI reading of around 30 back in early February, but that recovery arc is now visibly slowing.
Think of it like a car approaching a speed limit. The engine has been running hard for weeks, but the acceleration is fading right before the warning zone kicks in.
Here’s the specific concern: if the MFI crosses above 70 without Bitcoin breaking above $72,294 at the same time, that creates what’s called a bearish divergence. In plain terms, momentum peaks while price fails to follow. That’s usually a sign the rally is running on fumes.
On the downside, $70,000 is the psychological floor holding the near-term structure together. A daily close below it would expose $68,830 first, then $66,224. To the upside, clearing $72,294 is the immediate target — but $75,000 is the level that would actually signal a genuine recovery from this macro-driven range.
Decred Bears the Brunt of the Broader Stall
If Bitcoin is under pressure, Decred (DCR) is getting hit harder. The token is trading at $20.89, down 0.57%, and a key technical pattern suggests more downside may be coming.
![Decred DCR price chart showing Fibonacci 2.786 extension support at $20.34 with declining EMA resistance levels]
The setup involves what analysts call a measured move — essentially a projected price target based on previous swing patterns. That target sits at $20.34, which also happens to align with the Fibonacci 2.786 extension level, calculated from a recent swing high near $22.77. DCR is currently caught between that $20.34 floor and a blue exponential moving average (EMA) at $21.92, which is now acting as overhead resistance.
Both EMAs are sloping downward and pressing on price from above. A red EMA at $25.31 sits well above current levels, confirming the broader downtrend is intact. The range is narrowing, which typically means a decisive move is coming soon.
A daily close below $20.34 would complete the measured move and open the door to $19.06 as the next meaningful support. On the flip side, a recovery above $21.92 followed by a push past $25.04 would be needed to shift the structure from bearish to at least neutral.
What Needs to Happen for Sentiment to Shift
Right now, the crypto market is a passenger in a much larger macro story. Geopolitical tension, suppressed institutional risk appetite, and equity weakness are all working against meaningful upside. Bitcoin is within shouting distance of overbought territory but can’t break above key resistance. Altcoins like Decred are caught in a technical squeeze with limited room to maneuver.
The market isn’t broken. But it’s waiting for something — a ceasefire development, an institutional catalyst, or simply a clean break of resistance — to give it permission to move.
Until that happens, $2.37 trillion is the floor that matters most. Watch it closely. How the market behaves around that level over the next few sessions will say a lot about where this goes next.