
Dogecoin is sitting on thin ice right now. The coin trades at $0.0906, but the numbers underneath that price tell a worrying story.
New buyers have practically vanished. Network losses are at their worst point in months. And one broken support level could send DOGE tumbling another 23% from here.
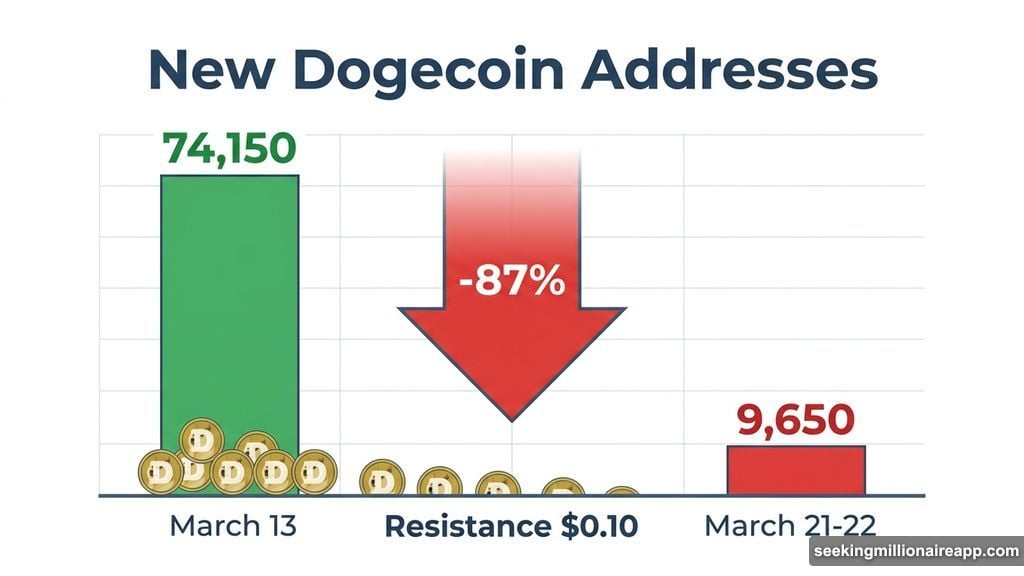
New Address Creation Collapsed 87% in 10 Days
Ten days ago, Dogecoin was pulling in fresh interest. On March 13, about 74,150 new addresses were created in a single day — the highest reading since a similar spike near 75,000 back on February 25.
But that excitement evaporated fast. By March 21–22, new daily address creation had crashed to roughly 9,650. That’s an 87% collapse in just 10 days, and it sits at the lowest level of the entire February–March window.
The pattern is worth paying attention to. Both spikes in new addresses happened when DOGE prices tried to push back above $0.10. Both times, those new buyers failed to hold the momentum and exited quickly. So the market keeps attracting people at resistance, then losing them within days. That’s not a healthy sign.
DOGE Realized Losses Hit Their Worst Level of the Period
Santiment’s Network Realized Profit/Loss data tells an equally uncomfortable story. DOGE holders have been booking losses almost continuously since late January.
The deepest single-period loss reading showed up around March 21–22, hitting approximately -$868K. That number surpasses even the February 5 and March 7 episodes — making it the worst loss-realization stretch visible in the current chart window.
When holders sell at a loss at this scale, it usually means recently acquired buyers are cutting their positions rather than waiting for recovery. Combined with the collapse in new address creation, the picture that emerges is a market where buyers are burning out faster than new ones are stepping in to replace them.
A Descending Triangle Points to Possible Further Drops
Technically, Dogecoin has been trapped inside a descending triangle since January’s highs above $0.14. The upper trendline has steadily declined from around $0.1157 in January to approximately $0.1007 today, capping every recovery attempt along the way.
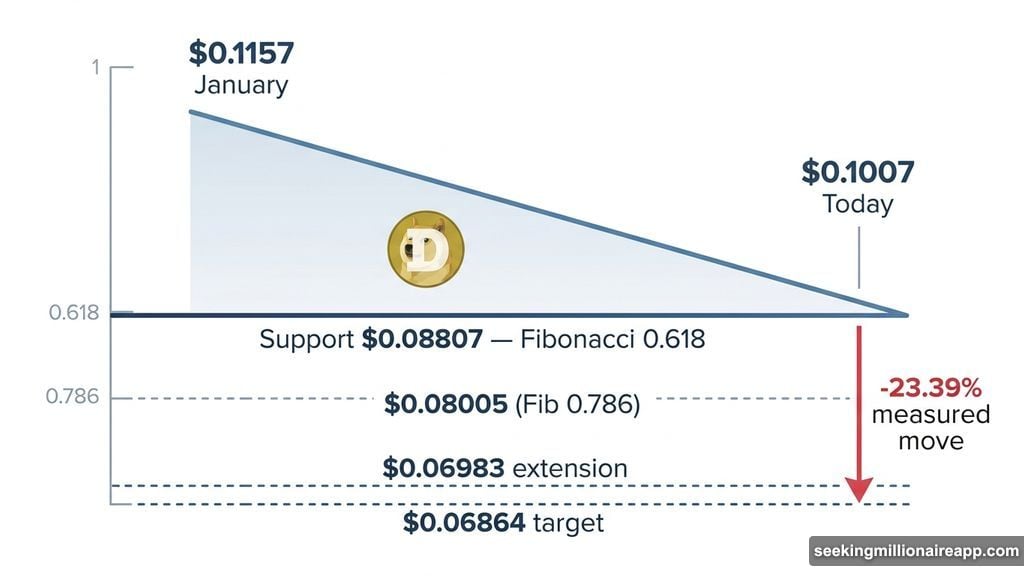
The flat support holding things together sits at the Fibonacci 0.618 level of $0.08807. If that level breaks, a 23.39% measured move projects a target of $0.06864. Importantly, this exact same percentage move already played out once this cycle — DOGE dropped from $0.1157 to $0.0881 in early February, so the pattern has real precedent here.
Below $0.08807, the next levels to watch are $0.08005 (the 0.786 Fibonacci level), followed by the $0.06983 extension and $0.06864 dashed support at the chart’s lower boundary.
One Potential Lifeline: X Money Integration
There is a scenario where this triangle breaks upward instead of down. The X Money platform entered closed beta in early March 2026, with a public launch announced for April. If Dogecoin integration gets officially confirmed, that could create the demand catalyst needed to push prices back above the descending trendline at $0.1007.
But without that confirmation, the chart’s geometry still points lower. The technical structure, the loss data, and the disappearing new-buyer activity all line up on the same side of the trade right now.
The $0.0881 level is the one number every DOGE holder should be watching closely. It has held before. Whether it holds again depends on whether real demand shows up — or whether the market keeps running out of buyers at exactly the wrong moment.