
Ethereum just jumped 23% off its lows. Traders are calling the bottom. But the charts and on-chain data tell a different story.
ETH hit its breakdown target near $1,800 in early February, exactly as analysts predicted. It bounced hard from $1,740. Yet this rebound lacks the strength that real bottoms show. Instead, several warning signs suggest the drop isn’t over.
The Breakdown Target Hit Right on Schedule
Back on February 5, Ethereum completed a textbook breakdown pattern on the daily chart. BeInCrypto analysts had flagged this setup earlier. The projected target sat near $1,800.
Ethereum followed the script perfectly. Price dropped to $1,740 on February 6. That level marked the exact target zone.
At first, the bounce looked strong. The February 6 candle showed a massive lower wick. That usually signals aggressive dip buying. But momentum metrics reveal a problem.
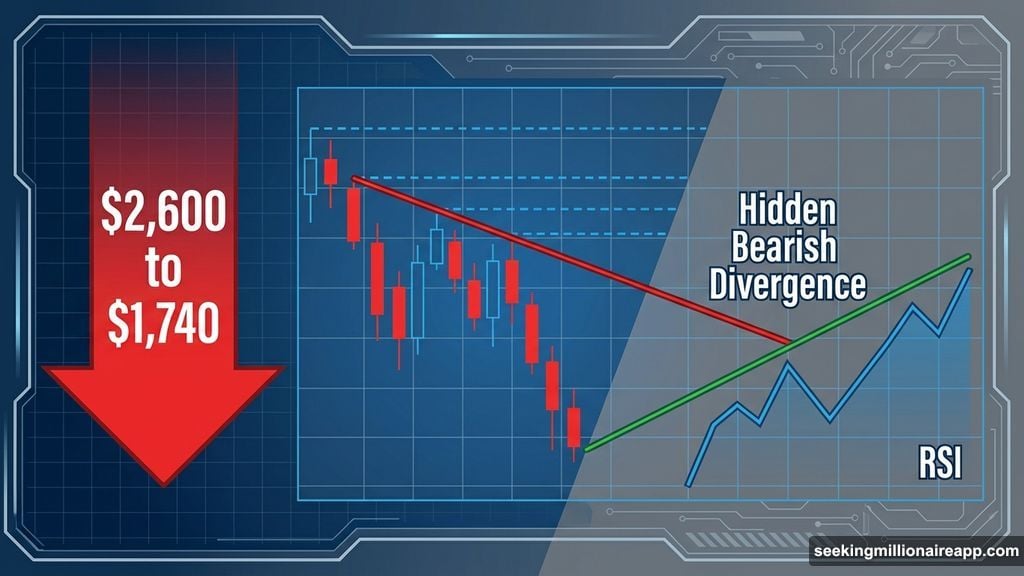
Between February 2 and February 8, price made lower highs. Meanwhile, the Relative Strength Index climbed higher. This creates what technical analysts call a hidden bearish divergence.
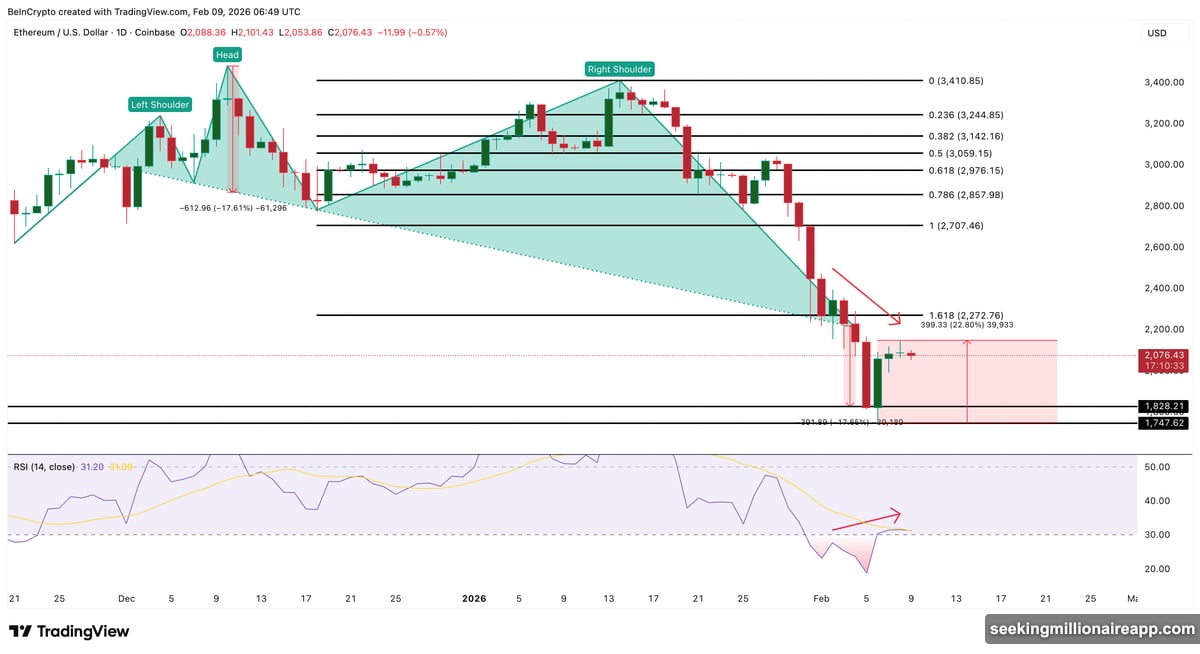
In simple terms, short-term momentum improved while price struggled to follow through. That pattern shows sellers lurking in the background, ready to step in. So while the breakdown played out as expected, the recovery lacks real conviction.
Bearish Flag Pattern Forms During the Bounce
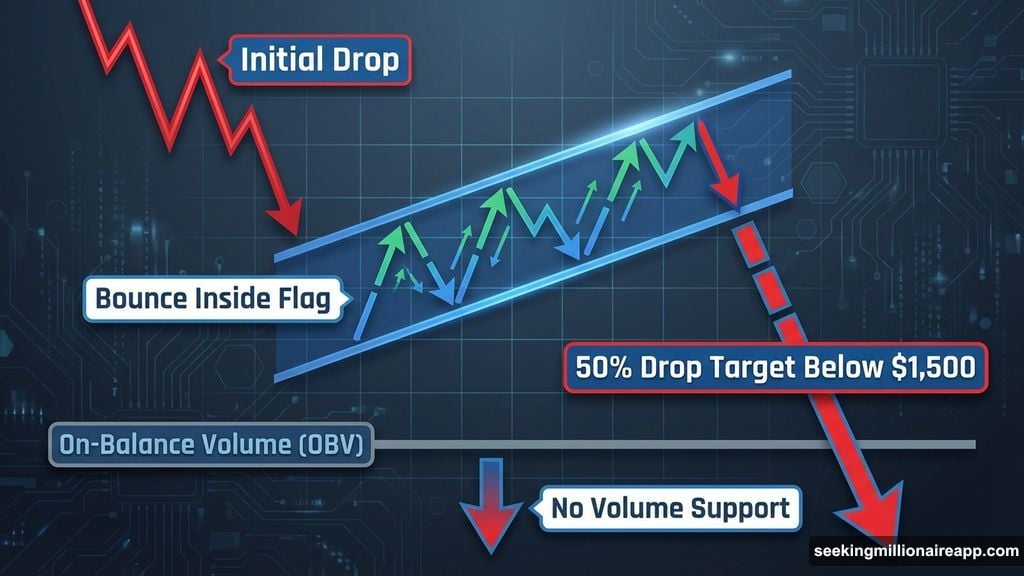
The rebound created another problem on the 12-hour chart. Ethereum is now forming a classic bearish pole and flag pattern.
First, price dropped sharply. Then it bounced inside a rising channel. This setup typically signals a pause before another leg down. Plus, volume confirms the weakness.
On-Balance Volume, which tracks real buying and selling activity, stayed flat during the entire rebound. It’s not rising aggressively like price. That means fewer genuine buyers are supporting this move.
Moreover, the OBV metric itself is approaching a breakdown of its own ascending trendline. If volume breaks down while price still sits inside this flag, the pattern could fail hard.
The technical projection points to a 50% drop from the lower trendline. That would put Ethereum well below $1,500. To understand whether buyers can prevent that outcome, we need to dig into the on-chain data.
Short-Term Traders Rush In While Long-Term Holders Bail Out
On-chain metrics reveal who’s actually buying this bounce. The short answer: mostly short-term traders, not long-term investors.
Short-term Holder NUPL measures whether recent buyers sit in profit or loss. In early February, as Ethereum dropped to $1,740, this metric fell to around -0.72. That placed it deep in the capitulation zone, reflecting heavy unrealized losses.
During the 23% rebound, NUPL recovered to about -0.47. That’s an improvement of roughly 35% from the bottom. While it remains negative, the speed of this recovery shows that many short-term traders jumped in to buy the dip.
Here’s the problem. This pattern closely matches past failed bottom formations. Back on March 10, 2025, NUPL also rebounded to around -0.45 while ETH traded near $1,865. Many traders called that a bottom too.
But the real bottom didn’t form until April 8, 2025. At that point, NUPL had dropped close to -0.80, roughly 75% deeper than the March level. That phase marked true seller exhaustion. Price sat around $1,470 at the time.
Today’s structure looks much closer to March 2025 than April 2025. Losses eased too quickly, suggesting panic hasn’t fully cleared. That’s a red flag.
Long-Term Holders Keep Selling Aggressively
Meanwhile, long-term investors show zero confidence at current levels. The 30-day rolling Hodler Net Position Change tracks investors holding ETH for more than 155 days. This metric remains deeply negative.
On February 4, outflows stood near -10,681 ETH. By February 8, they had widened to around -19,399 ETH. That’s an increase in net selling of roughly 82% in just four days.
So while short-term traders chase a bounce, long-term holders continue dumping their positions. This divergence rarely ends well. Strong bottoms form when long-term investors start accumulating, not when they’re racing for the exits.
The combination of weak volume, early NUPL recovery, and accelerating long-term holder selling paints a clear picture. This bounce is being driven by speculative short-term traders, not deep conviction.
Critical Price Levels Show the Path to $1,000
Technical and on-chain signals now align on the bearish side. Ethereum must reclaim key resistance levels to invalidate this setup.
The first resistance sits near $2,150. Holding above this would ease immediate pressure. But the major invalidation level is $2,780. Only a move above that would truly break the bearish structure.
On the downside, several support levels could slow the decline. Here’s what to watch:
$1,990: Short-term support zone. A daily close below this would weaken the current rebound structure.
$1,750: Fibonacci retracement support. Losing this level would expose the next major zone.
$1,510: Critical retracement level, close to the April 8, 2025 bottom at $1,470. This could provide stronger support.
$1,000: Bear flag projection target. This would represent a drop of nearly 50% from current levels.
Right now, Ethereum remains trapped below major resistance. Volume stays weak. Long-term holders are selling aggressively. Short-term traders dominate activity.
These conditions rarely produce sustainable bottoms. Instead, they typically precede another leg down. The 23% bounce looks impressive on the surface, but underneath, the foundation remains fragile.
The risk of a much deeper Ethereum price move toward $1,000 stays very real. Until volume surges, long-term holders stop selling, and price breaks above $2,780, the bearish setup remains intact.