
Ethereum just posted a 7% rebound. Sounds encouraging, right? But dig a little deeper and the picture gets complicated fast.
The bounce started around March 8 and follows a familiar technical signal that previously sparked a much stronger rally. However, the data behind this recovery looks noticeably weaker than last time. And for ETH holders hoping this is the start of something bigger, that gap matters a lot.
Let’s walk through what’s actually happening here.
The RSI Divergence That Sparked Two Rallies
The rebound traces back to a bullish divergence on Ethereum’s 8-hour chart. If that term sounds intimidating, here’s a simple way to think about it.
Imagine a runner slowing down but still finishing each mile faster than expected. The pace says “tired,” but the underlying effort says “not done yet.” That’s basically what a bullish RSI divergence signals. Price keeps falling, but momentum is quietly strengthening underneath.
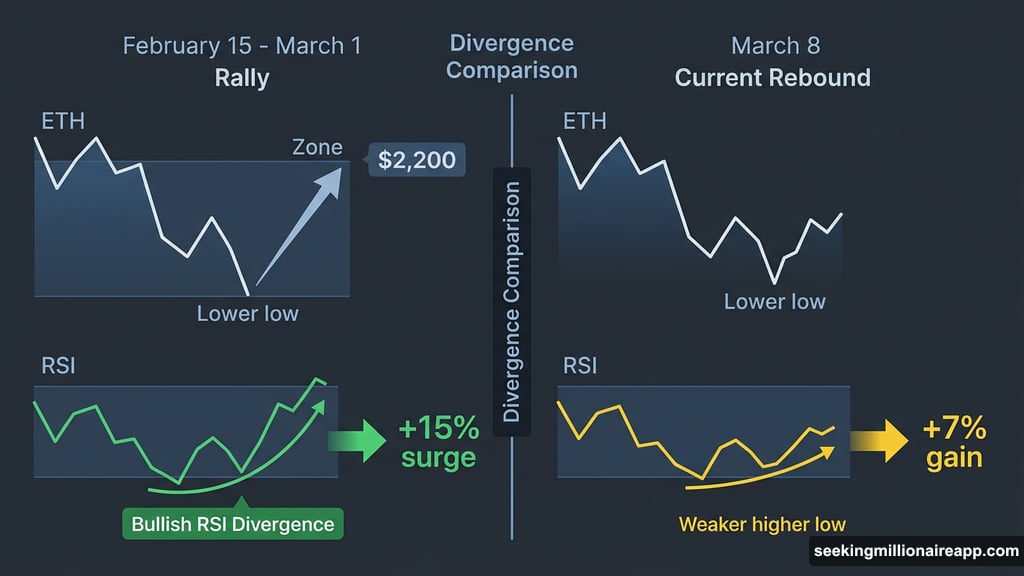
Between February 15 and March 8, Ethereum’s price printed a lower low while the Relative Strength Index (RSI) formed a higher low. That mismatch suggests selling pressure is fading before the price fully reflects it.
Here’s the kicker. A nearly identical setup appeared earlier, between February 15 and March 1. After that signal flashed, Ethereum surged more than 15%, climbing all the way to a local high near the $2,200 zone before stalling. So naturally, traders are watching this second divergence closely.

The current signal has already produced a 7% gain. The question is whether it has the fuel to go further.
Exchange Flows and Whale Activity Flip the Script
This is where things get less optimistic. The first divergence-driven rally had something this one doesn’t: real buying conviction behind it.
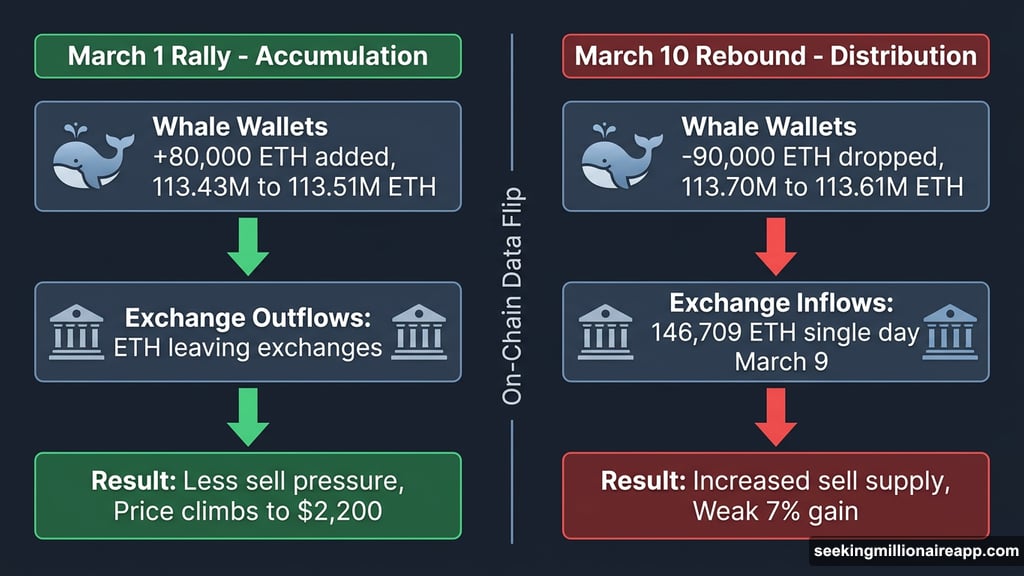
During the earlier March rally, Ethereum saw consistent exchange outflows. Coins were leaving exchanges, which typically signals that investors are moving ETH into cold storage or long-term holding. Less supply on exchanges generally means less selling pressure. That dynamic helped carry the price higher.
Whale wallets backed that move too. Large holders added roughly 80,000 ETH between February 28 and March 3, pushing their combined holdings from 113.43 million to 113.51 million ETH. Big money was accumulating, not distributing.
Fast forward to the current rebound, and the script has flipped entirely.
On March 9, exchange inflows hit 146,709 ETH in a single day. That means coins are flowing back onto exchanges, which increases the available supply for selling. Getting hit with sell pressure immediately after a technical signal is not what bulls want to see.
Whale behavior tells the same story. Large holders dropped their combined ETH supply from 113.70 million to approximately 113.61 million ETH between March 7 and March 10. That’s about 90,000 ETH quietly leaving whale wallets in just a few days.
So instead of accumulation fueling this rally, distribution appears to be shadowing it.
A Dense Supply Wall Sitting Right Above Current Prices
Even if buyers push harder from here, on-chain data points to serious resistance just overhead.
Analysts use a metric called URPD, or UTXO Realized Price Distribution, to map out where large chunks of Ethereum supply last changed hands. Think of it like a map of investors who bought at specific prices. When the market climbs back toward those levels, many of those holders may decide to sell and recover their investment.
Right now, several large supply clusters are stacked directly above Ethereum’s current price. About 1.42% of total ETH supply sits near $2,029. Another 1.06% clusters around $2,079. Add in 0.88% near $2,128 and 0.91% near $2,178, and you’re looking at over 4% of Ethereum’s entire supply packed into a roughly $150 price corridor.
That’s a lot of potential sellers waiting at the door.
If those holders start selling as prices rise toward their cost basis, the rebound could run straight into a wall. And with exchange inflows rising and whales stepping back, there may not be enough fresh buying to absorb the pressure.
What ETH Needs to Actually Recover
For this rebound to turn into something meaningful, Ethereum needs to clear some specific hurdles.
The first real test sits around $2,130, which overlaps with the lower end of the supply clusters described above. Getting through that level would signal some genuine demand absorption.
Beyond that, $2,200 remains the key psychological level. It capped the previous rally and represents the clearest line between a weak bounce and a real recovery. A strong close above $2,200 on the 8-hour chart would suggest Ethereum has worked through the nearby supply overhang.
From there, $2,270 emerges as the next resistance zone, with its own notable supply cluster. Crossing that level would go a long way toward rebuilding confidence in a sustained uptrend.
On the downside, losing $2,000 would seriously undermine the current rebound thesis. A drop toward $1,910 would reinforce the broader bearish structure that has been in place for most of 2026. Worth remembering that ETH is still down about 31% year-to-date, which puts this 7% bounce in sobering perspective.
The Honest Assessment
Ethereum’s latest bounce is technically legitimate. The RSI divergence is real, and price is responding. But the support structure underneath this rally looks fragile compared to what drove the earlier 15% move.
Weak whale accumulation, rising exchange inflows, and a heavy supply corridor overhead all point toward stronger resistance this time around. The same signal fired, but the conditions backing it are meaningfully different.
That doesn’t mean the rally fails from here. It means it has to work harder to prove itself. Watch how price handles those supply clusters between $2,030 and $2,180. How Ethereum behaves in that zone will tell you far more than the initial bounce already has.