
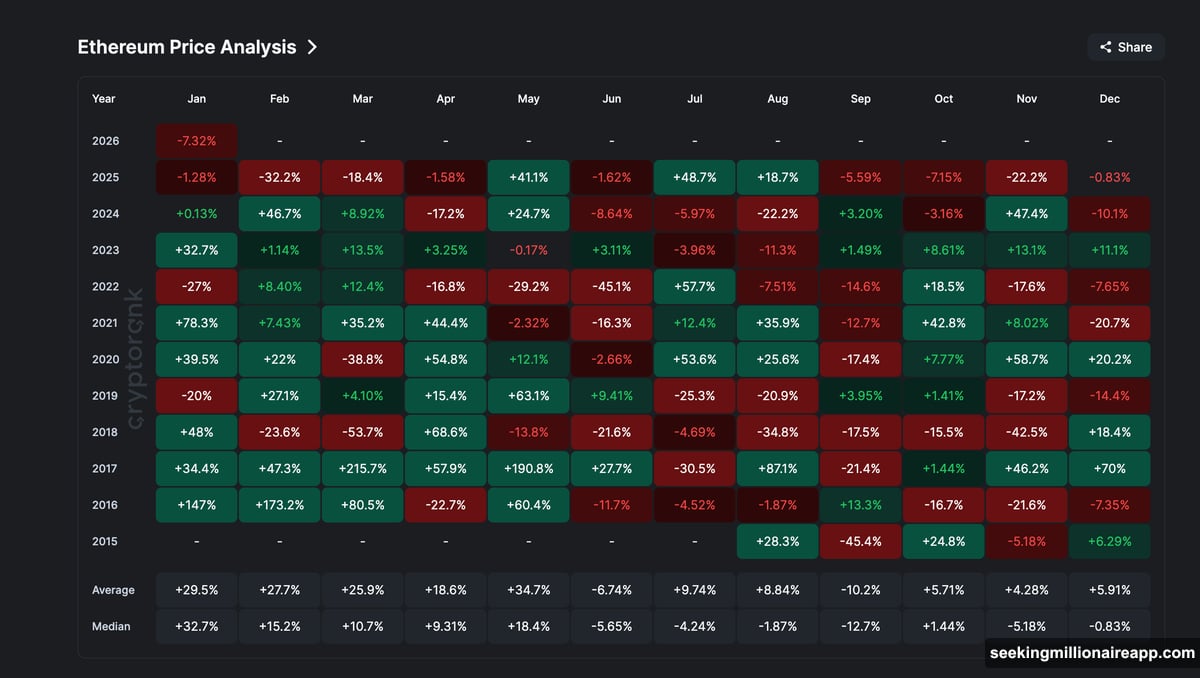
Ethereum closed January down 7%. That’s a sharp break from its usual pattern. Historically, January delivers median gains near 32%. This year moved the opposite direction.
February tells a different story in the data. Since 2016, ETH has posted median gains around 15% during this month. But last February? The price collapsed 37%. So the question isn’t whether history matters. It’s whether 2026 follows the pattern or breaks it entirely.
Right now, technical structure points both ways. On-chain data shows whales accumulating aggressively. Yet institutional money through ETFs remains cautious and inconsistent. Meanwhile, momentum indicators suggest selling pressure is fading, but true capitulation hasn’t arrived.
That leaves Ethereum at a crossroads. The next few weeks will determine whether ETH rebounds toward $4,000 or slides back to $2,100.
The Wedge Pattern That Could Spark 60% Gains
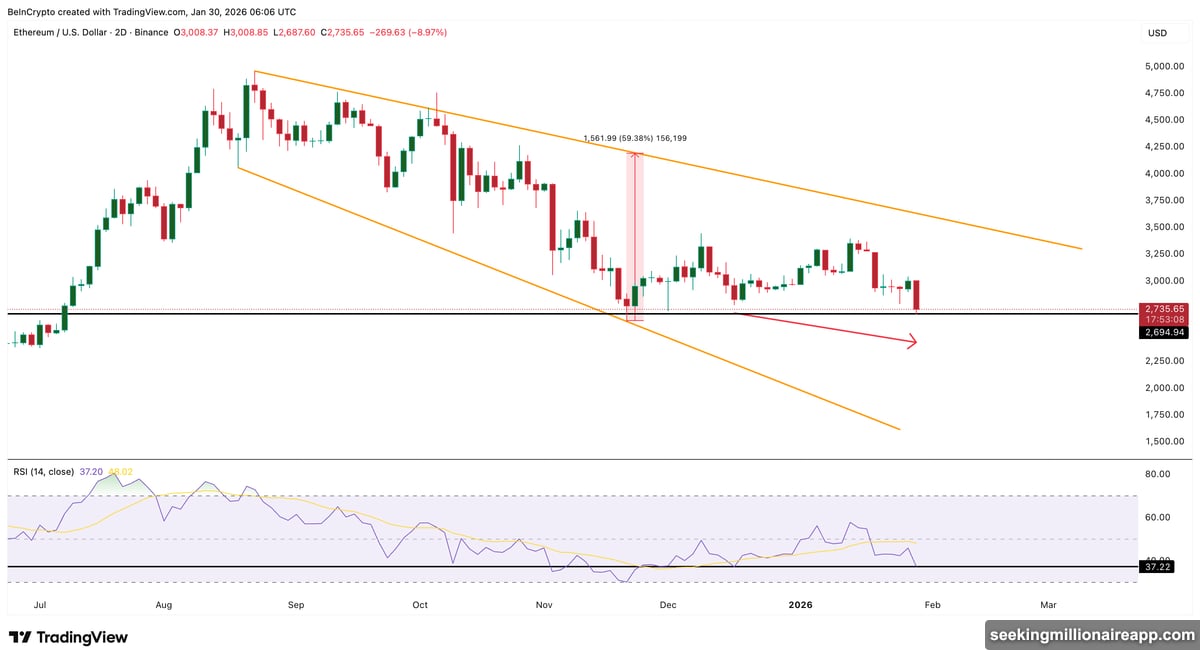
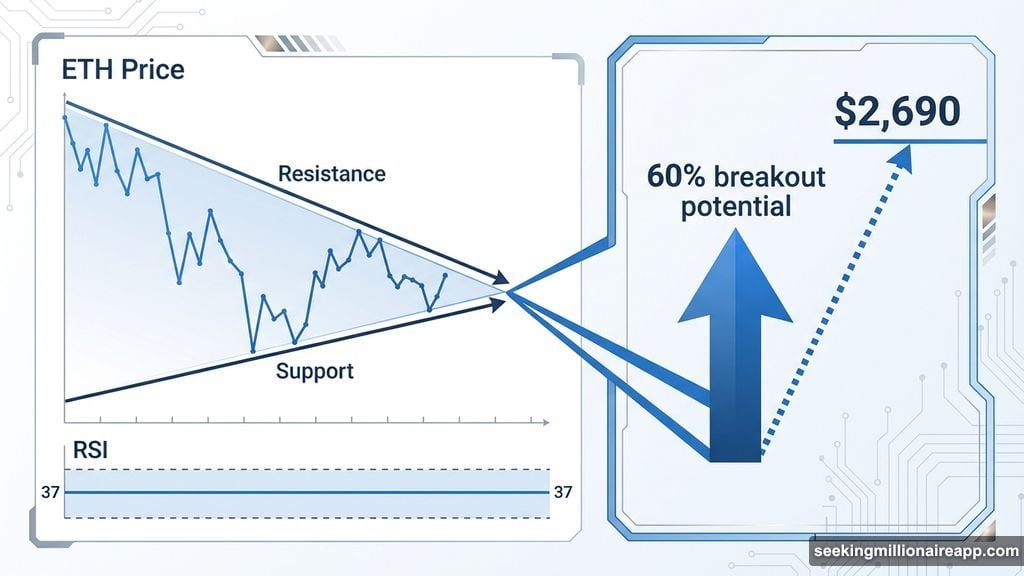
Price action on the two-day chart shows Ethereum trapped inside a falling wedge. This pattern forms when an asset makes lower highs and lower lows within converging trendlines. Typically, falling wedges signal weakening seller control and set up reversal potential.
In Ethereum’s case, the wedge is wide and volatile. A confirmed breakout would project roughly 60% upside from current levels. That doesn’t mean ETH will hit that target. But it shows the technical potential if momentum shifts.
Between December 17 and January 29, price continued making lower lows. During that same period, the Relative Strength Index held near 37. RSI measures momentum strength between buyers and sellers. When price falls but RSI doesn’t follow, it creates bullish divergence.
This divergence suggests selling pressure is losing steam. However, confirmation requires the next candle to close above $2,690. If that happens while RSI stabilizes, reversal odds improve significantly.
But technical patterns alone don’t tell the full story. On-chain metrics provide the first real validation test.
On-Chain Signals Show Relief, Not Capitulation
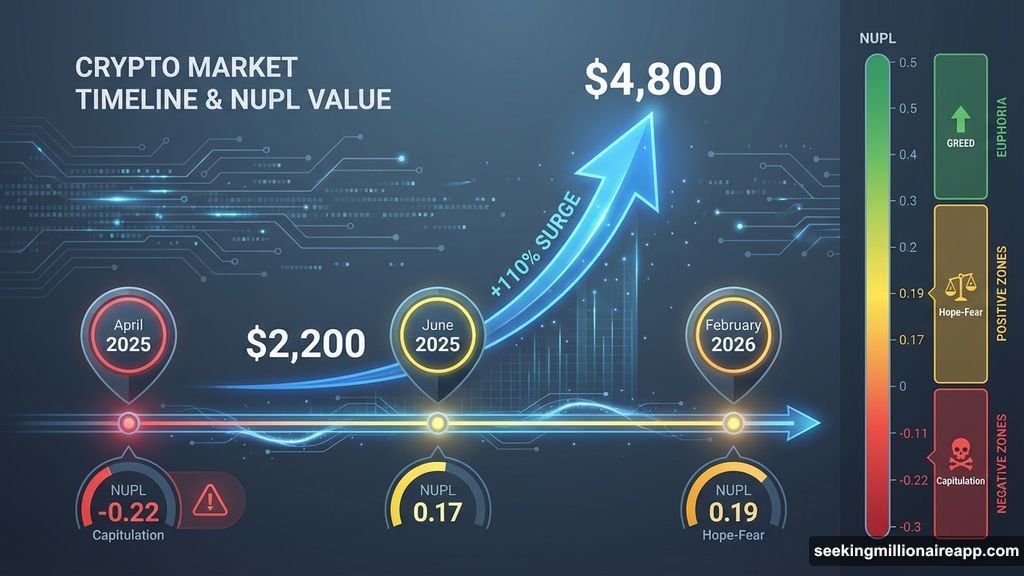
Net Unrealized Profit/Loss currently sits at 0.19. This metric measures paper profits and losses across all holders. At 0.19, Ethereum rests in the “hope-fear” zone. That level carries historical significance.
Back in June 2025, NUPL dropped to 0.17 while ETH traded around $2,200. Over the following month, price surged toward $4,800. That’s a gain exceeding 110%. So current NUPL readings align with what the wedge pattern suggests: selling pressure is easing, and room for upside exists.
Yet the signal remains incomplete. True market bottoms typically occur when NUPL turns negative. In April 2025, it fell to roughly -0.22, marking full capitulation. Today’s reading stays far above that threshold. This means more downside room still exists.
So NUPL validates the rebound case but warns against expecting a cycle reset. Relief rallies remain more likely than sustained trend reversals.
Long-term holder behavior reinforces this cautious outlook. The Hodler Net Position Change metric tracks whether veteran investors are accumulating or distributing. Throughout January, this metric stayed positive, indicating net buying.
Accumulation peaked January 18 at roughly 338,700 ETH. By January 29, it had dropped to around 151,600 ETH. That represents a decline exceeding 55%. So holders continue buying, but with far less conviction than earlier in the month.
John Murillo, Chief Business Officer at B2BROKER, a global fintech solutions provider, warns that demand and supply currently balance each other. Plus, without a clear directional impulse, the market lacks decisive momentum. That fits perfectly with what on-chain data reveals: support exists, but enthusiasm is fading.
Whales Buy Aggressively While ETFs Stay Cautious
Large holder behavior tells a different story than institutional flows. Supply data shows whales controlled about 101.18 million ETH at the start of January. By month-end, that figure had risen to roughly 105.16 million ETH. That’s an increase of nearly 4 million ETH during price weakness.
This accumulation occurred while Ethereum declined from mid-January highs. So whales actively added exposure during the pullback. This behavior sharply contrasts with February 2025, when whale holdings fell from 105.22 million ETH to 101.96 million ETH. Last year, whales distributed into weakness. This year, they’re accumulating.
However, spot ETF flows paint a more cautious picture. January saw several strong inflow days followed by major outflows. Late-month withdrawals exceeded 70,000 ETH equivalents. So institutional money through ETFs hasn’t joined the rebound trade decisively.
Murillo suggests these flows reflect tactical rebalancing rather than structural exit. The late-month reversal, led by large inflows into Fidelity’s FETH, shows institutional behavior is increasingly two-sided. Instead of wholesale risk reduction, flows appear fragmented across different issuers.
But if choppy ETF flows continue into February, derivatives markets may seize control of price discovery. That creates a key risk: leverage-driven price action could override spot demand signals. February will test whether Ethereum’s price anchors more to institutional spot allocation or derivatives momentum.
For now, whales signal optimism. Institutions remain hesitant. That combination supports bounce potential but limits sustainability.
Critical Price Levels That Will Decide February
The first major support sits near $2,690. This aligns with recent two-day support and prior consolidation zones. A clean close below this level would signal sellers regaining control. That opens downside toward $2,120, a zone representing deeper correction territory.
On the upside, Ethereum must reclaim $3,000 first. This level acts as both a psychological barrier and structural resistance. Price has repeatedly failed here since December. Holding above $3,000 would signal confidence returning to the market.
Next resistance stands near $3,340. This level has capped rallies since December 9. A breakout would mark a meaningful shift in price structure. Above that, $3,520 becomes critical. A sustained break and hold above this point would confirm momentum recovery and open upside toward $4,030.
However, analysts at B2BINPAY, an all-in-one crypto ecosystem for businesses, caution against relying on historical patterns. They point out that Ethereum currently lacks immediate growth catalysts. Moreover, February 2025 saw a 37% decline despite seasonal expectations. So blindly assuming February brings gains makes little sense without fresh bullish drivers.
The Real Risk Nobody’s Talking About
Ethereum’s current position mirrors June 2025 more than April 2025. Back in June, NUPL readings were similar, and price bounced strongly. But June wasn’t a cycle bottom. It was a relief rally within a larger downtrend.
April 2025 marked true capitulation. NUPL went negative. Holders sold at a loss. That created the foundation for sustained recovery. Today’s NUPL stays well above that threshold. So while technical patterns and whale accumulation suggest bounce potential, deeper correction risk remains.
The B2BINPAY team emphasizes this point directly. They note that demand and supply currently balance at similar levels. Without a clear impulse in either direction, the picture stays murky. So February could deliver gains. Or it could extend January’s weakness.
What matters most is whether institutional flows stabilize. If ETFs reverse course and show consistent inflows, that validates the whale accumulation signal. If outflows continue, derivatives-driven volatility takes over. That shifts price discovery away from spot markets and toward leverage.
Either way, the next few weeks determine whether Ethereum’s falling wedge breaks up or down. Historical February strength suggests upside. But 2025’s February collapse warns against complacency. The technical structure supports both outcomes. Only momentum will decide.