
Ethereum sits at $2,108 on April 7, down about 1% over the last 24 hours. On the surface, that looks pretty boring. Nothing exciting, nothing alarming.
But look a little closer, and something interesting is happening beneath the price action. Four separate signals — spanning technical charts, derivatives markets, and on-chain whale data — are all quietly lining up in the same direction. And that direction isn’t down.
The last time a similar setup appeared on the chart, ETH rallied 16%. Here’s what’s building right now.
Two EMA Signals Closing In Fast
First, let’s talk about the Exponential Moving Averages (EMAs). Think of EMAs as trend-tracking lines on a chart. A faster-moving line (the 20-period EMA) and a slower one (the 50-period EMA) are currently sitting just $3 apart on the 12-hour chart — at $2,083 and $2,086 respectively.
When the faster line crosses above the slower one, traders call it a bullish crossover. It signals that short-term momentum is shifting upward.
This exact setup appeared in mid-March. After that crossover confirmed, ETH rallied 15.63% and reclaimed its 100-period EMA in the process. Now the same pattern is forming again. Since April 5, prices already moved up 7.59%, and the crossover looks closer than ever. If it confirms, the next target in focus becomes the 100-period EMA sitting at $2,144.
RSI Divergence Says Selling Is Fading
The second technical signal is a classic RSI (Relative Strength Index) divergence. Between March 19 and April 6, ETH made a lower price low on the chart. But the RSI momentum indicator made a higher low at the same time.
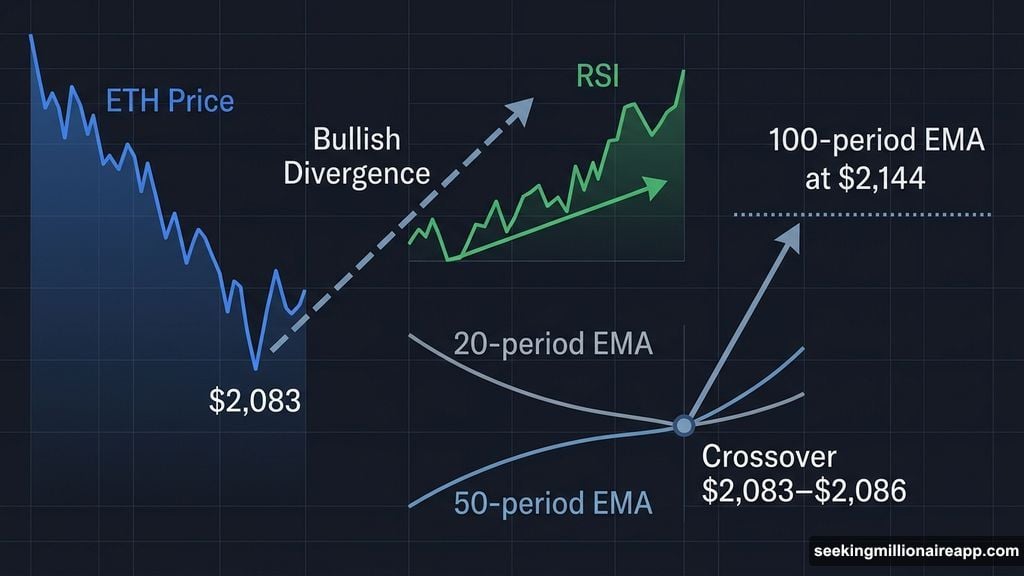
That gap matters. It tells you that even though price dipped, selling pressure was actually weaker than before. The bears are losing steam, even if the price doesn’t show it yet.
This divergence stays valid as long as ETH holds above $2,086. A clean close below that level would reset the setup and delay the signal — but for now, it’s intact.
Short Sellers Are Stacking Up — and That’s Fuel
Here’s where it gets really interesting. Between April 4 and April 7, total open interest in Ethereum futures rose from $10.49 billion to $10.77 billion. At the same time, funding rates dropped from -0.0015% to -0.007%.
So what does that mean in plain English? More traders are opening new short positions, betting that ETH falls further.
That might sound bearish. But it actually creates what traders call a short squeeze setup. If the price moves up instead of down, all those short sellers scramble to close their positions by buying ETH. That buying pressure can accelerate a rally fast. The more shorts piled in, the more fuel sits waiting to ignite.
Whales Are Buying the Dip, Not Running From It
The fourth signal comes from on-chain data tracking large wallet holders — often called whales. Since April 3, whale holdings (excluding exchange wallets) grew from 122.73 million ETH to 122.92 million ETH.
That’s roughly 190,000 ETH added, worth about $400 million at current prices. It’s not aggressive, headline-grabbing accumulation. It’s steady, quiet buying through a period of weakness.
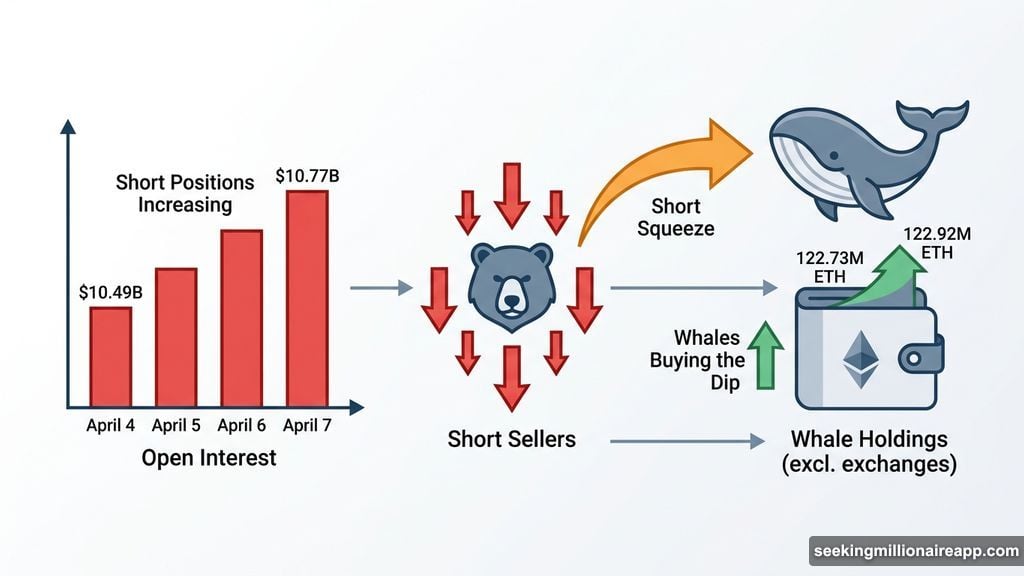
More importantly, whales haven’t been selling during the dip. They’re holding and adding. That creates a layer of spot market support sitting underneath all the derivatives action above.
The Price Levels That Actually Matter Now
All four signals point the same direction. But whether the bounce delivers comes down to specific price levels.
The first hurdle is $2,116. A 12-hour close above this zone would likely confirm the EMA crossover and add real momentum to the move.
Above that, $2,172 is the big one. This level has rejected ETH repeatedly since mid-March. Breaking cleanly above it would mark the first genuine shift in short-term structure. For the bounce to prove itself, ETH needs to push toward $2,228 — roughly a 5.77% move from current prices — and close above it.
On the downside, $2,086 is the critical support floor. Below that, $2,047 becomes the next line of defense. And if ETH breaks below $2,047, the four-signal setup loses its teeth and $1,935 comes into view.
Right now, the technicals have the blueprint, the derivatives market has the fuel, and the whales are providing the floor. Whether all three combine into an actual rally depends on how price handles those key levels over the next few sessions.
A confirmed 12-hour close above $2,172 would tell you the bounce is real. A drop below $2,086 says the market needs more time to reset.
This article is for informational purposes only and should not be considered financial or investment advice. Always conduct your own research and consult a professional before making any financial decisions.