
Ethereum price action is heating up. The second-largest crypto by market cap traded near $3,850 Thursday as institutional money flooded into derivatives markets at record levels.
But here’s the twist. While big banks can’t agree on where ETH ends the year, whales are scooping up millions. Plus, spot ETF flows tell a different story than futures markets.
Let’s break down what’s actually happening beneath the surface.
CME Derivatives Just Went Parabolic
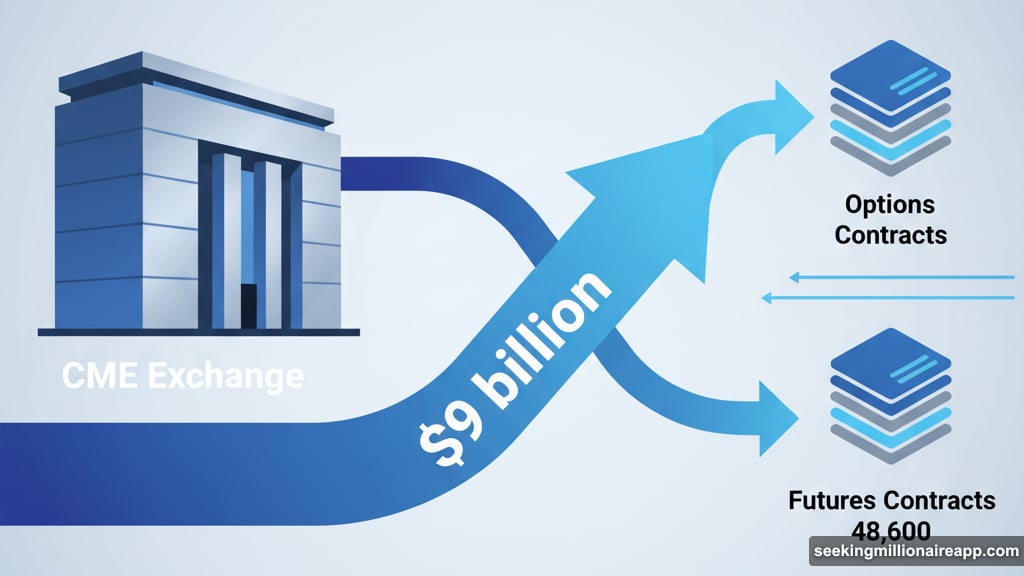
Institutional traders are placing massive bets on Ethereum’s future. CME data shows options open interest around $9 billion with futures contracts hitting roughly 48,600.
That’s not just big. It’s record territory.
These numbers signal something important. Professional money managers are building positions through regulated derivatives. They’re not buying spot ETH directly. Instead, they’re using options and futures to gain exposure with leverage.
Why does this matter? Derivatives volume often precedes major price moves. When institutional open interest surges, volatility typically follows within weeks.
However, this setup cuts both ways. High leverage magnifies gains during rallies. But it also amplifies losses when prices reverse. So the $9 billion in options could fuel either a breakout above $4,000 or a sharp correction.
Spot ETFs Show Mixed Signals
BlackRock’s ETHA fund pulled in $110.7 million on October 22 according to Farside Investors. That’s solid institutional demand through traditional finance channels.
Yet Fidelity and Grayscale logged withdrawals the same day. Net flows settled around $38 million after accounting for outflows.
This divergence reveals competing strategies. Some institutions are accumulating ETH exposure. Others are reducing positions or taking profits. Neither group dominates right now.
Compare this to derivatives markets. There, institutional activity hit all-time highs. So traders are building leveraged positions while spot demand remains measured.
What explains the gap? Derivatives offer flexibility that spot ETFs can’t match. Traders can short, hedge, or leverage positions. Spot ETFs only allow long exposure with no borrowed capital.
Banks Can’t Agree on Year-End Targets
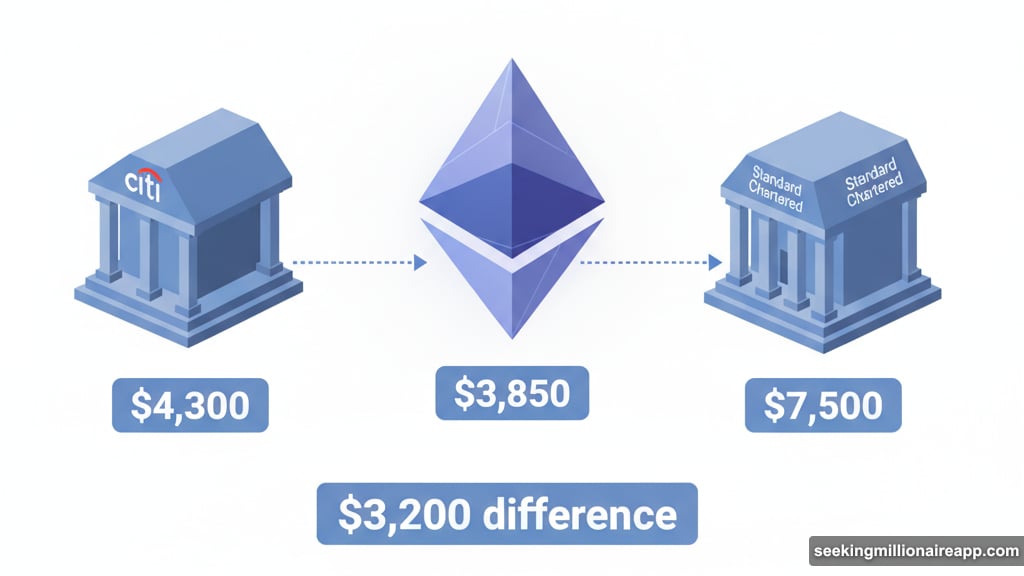
Citi set a base target of $4,300 for Ethereum according to Reuters. The bank noted current prices already sit above typical activity levels. Their bullish scenario reaches $6,400 while the downside case drops to $2,200.
Standard Chartered took a radically different view. Analyst Geoff Kendrick raised the year-end target to $7,500. His thesis centers on stablecoin growth and staking demand.
“We expect the stablecoin sector to grow about eightfold by the end of 2028,” Kendrick told Reuters.
That’s a $3,200 spread between base targets. Both banks can’t be right.

Here’s my take. Citi’s $4,300 target looks conservative but achievable. Standard Chartered’s $7,500 call requires perfect conditions including sustained stablecoin adoption and zero major market disruptions.
Reality usually lands somewhere between pessimistic and optimistic forecasts. So $5,000 to $5,500 seems more realistic than either extreme.
Whales Are Buying Again
One large investor purchased 12,000 ETH worth approximately $46 million. That transaction caught attention across crypto communities as a bullish signal.
Why? Whales typically have better information than retail traders. They employ analysts, monitor order books, and often know about developments before public announcements.
When whales accumulate during consolidation, it often precedes rallies. They’re building positions before momentum returns. Retail traders usually buy after prices already moved higher.
Community sentiment polls showed 82% of traders expecting continued upward movement. Only 18% expressed bearish views.
That’s extremely lopsided. Crowded trades often reverse unexpectedly. So while whale buying signals confidence, overwhelming bullish sentiment creates risk.
Technical Setup Shows Pattern Break
Ethereum broke above a descending trendline that capped rallies since 2021. This move shifted $3,800 from resistance into support.
The daily chart displays higher lows forming after pullbacks. That pattern typically indicates buyers returning at each dip. Momentum indicators point to neutral-to-slightly bullish conditions.
Resistance clusters between $3,900 and $4,100. Multiple attempts to break $4,000 failed over recent sessions. Each rejection creates overhead supply that must get absorbed before sustained upside.
The four-hour timeframe shows consolidation between $3,860 support and $3,920 resistance. A strong daily close above $4,000 would confirm the breakout structure. That could open a path toward $4,020 and potentially higher levels.
On the downside, losing $3,860 support could trigger another test of $3,740. Traders are watching whether price can break through near-term resistance with volume.
What This Means for Your Strategy
Ethereum’s setup presents opportunity mixed with uncertainty. Record derivatives activity and whale accumulation suggest institutional confidence. But mixed ETF flows and crowded sentiment create caution.
The $4,000 level matters more than usual. It’s psychological resistance, technical ceiling, and the gateway to higher prices. Breaking through with conviction could spark momentum toward bank targets above $4,300.
Yet failure at this level could disappoint overleveraged bulls. High open interest means forced liquidations could accelerate any decline. So position sizing matters more than usual right now.
For conservative traders, waiting for a confirmed breakout above $4,000 makes sense. Aggressive players might accumulate near support around $3,860 with tight stops below $3,740.
Either way, the next few weeks determine whether Ethereum powers toward $5,000 or consolidates longer. The ingredients for a major move are present. Now we wait to see which direction breaks first.