
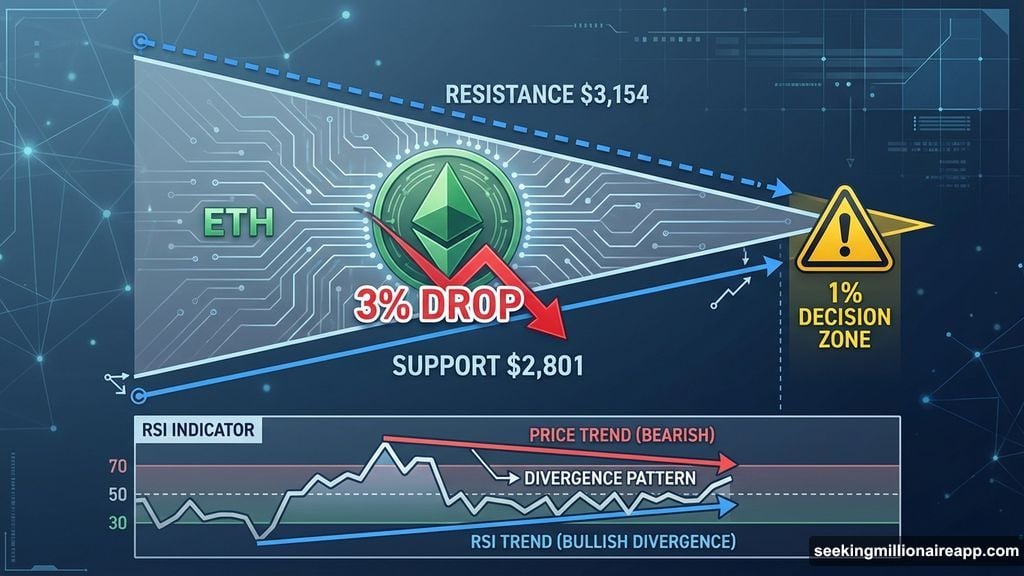
Ethereum price sits at a dangerous spot. After dropping 3% in a day, ETH now trades inside a contracting triangle that’s running out of room. One direction promises an 11% rally. The other risks a 20% slide. And the decision zone between them measures less than 1%.
Here’s what makes this setup unusual. The chart shows early rebound signals through hidden bullish divergence. But on-chain data reveals a massive supply wall that could crush any bounce attempt. Meanwhile, critical support sits just 1% below current price, making downside risk immediate.
Let’s break down what’s actually happening and where Ethereum might move next.
Triangle Compression Creates Decision Point
Ethereum trapped itself inside a narrowing triangle pattern. This structure forms when price swings get smaller over time, showing buyers and sellers can’t agree on direction. Eventually, one side wins and price breaks out sharply.
Right now, ETH hovers near the lower triangle boundary. This zone typically marks where selling exhaustion begins. Between December 1 and December 17, price printed a higher low while the RSI momentum indicator made a lower low.
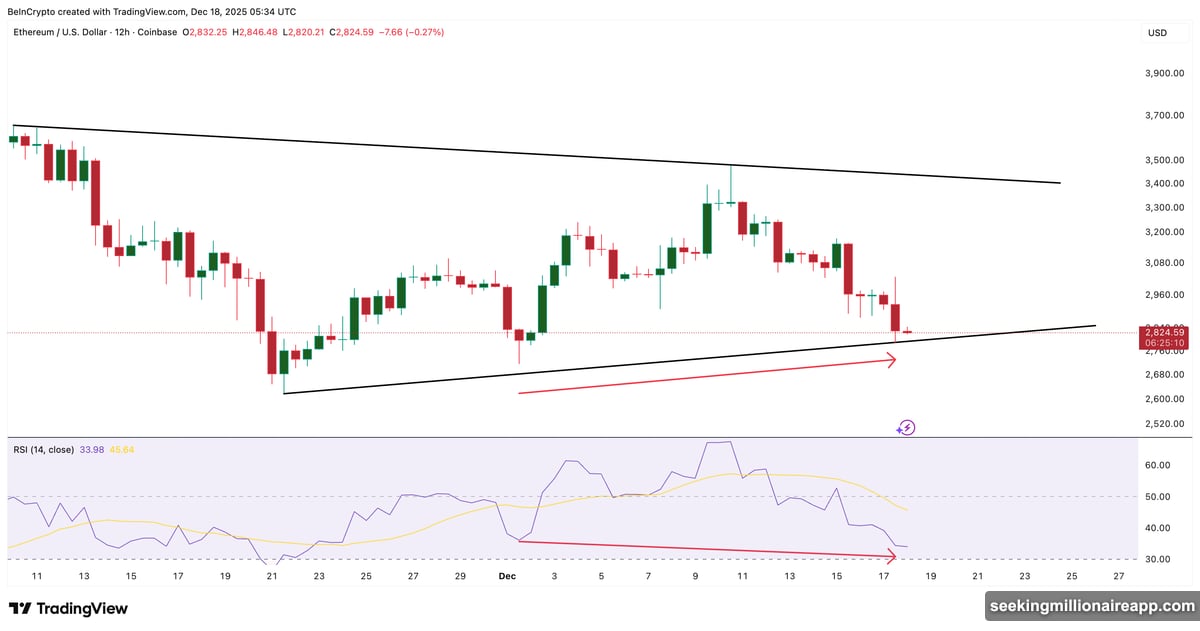
That’s hidden bullish divergence. It suggests sellers are losing strength even though price continues falling. However, this divergence doesn’t guarantee a rally. It just means downside pressure might be fading as Ethereum approaches structural support.
The problem? Buyers haven’t stepped in yet. So the next move depends entirely on whether support holds or breaks. And that decision point sits uncomfortably close to current levels.
Supply Wall Blocks Path Higher at $3,154
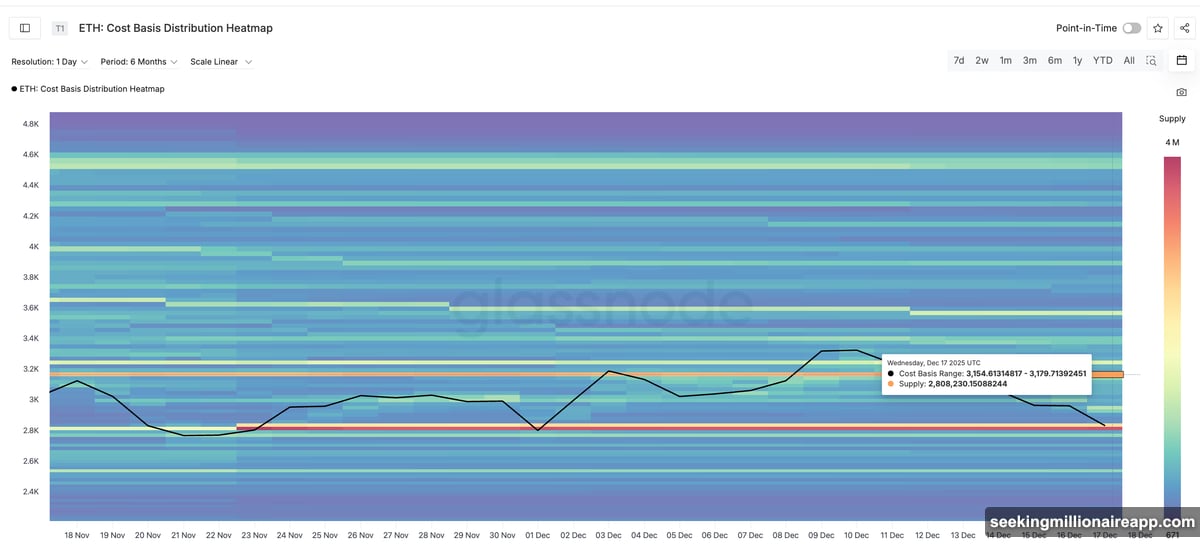
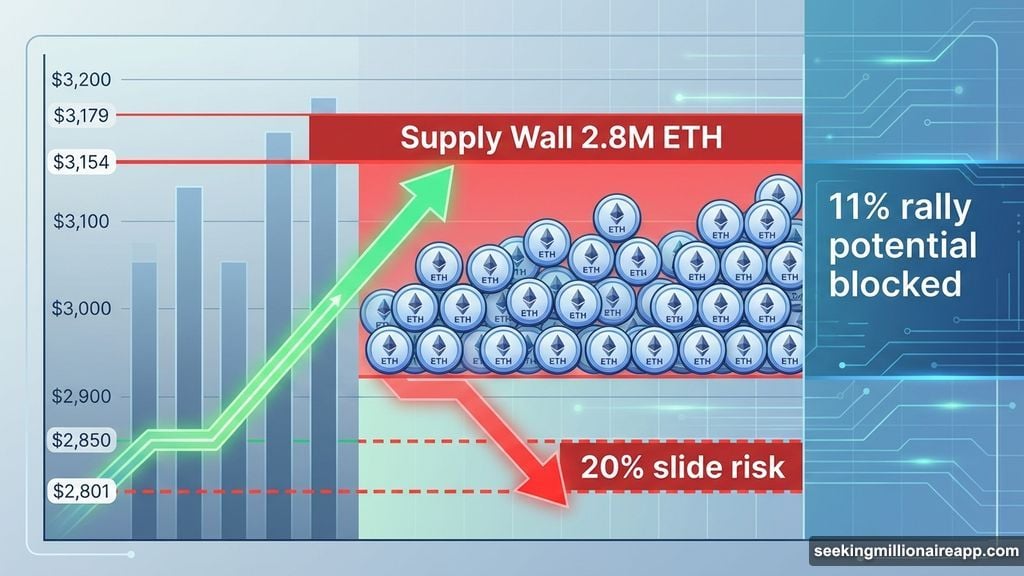
On-chain cost basis data reveals why any bounce might stall quickly. The strongest resistance zone sits between $3,154 and $3,179, where approximately 2.8 million ETH were accumulated by investors.
This creates a massive supply wall. When price revisits this range, many holders reach break-even and typically sell to exit their positions. That selling pressure caps rallies.
This resistance aligns almost perfectly with the chart resistance at $3,149. That level represents an 11% gain from current price. So even if Ethereum rebounds from triangle support, the rally likely stops there unless buyers push through with serious volume.
Here’s the catch. Any bounce that fails to close daily candles above $3,179 remains corrective, not trend-changing. The supply wall acts like a ceiling that keeps blocking upside attempts.
Critical Support Zone Sits Just 1% Below Price
The downside picture looks more fragile. The most important support cluster spans $2,801 to $2,823. This range previously acted as a demand zone where buyers stepped in to support price.
A daily close below $2,801 would break that support. And here’s the scary part: that break requires barely a 1% drop from current levels. That’s an extremely thin margin.
If that support fails, the next major floor sits at $2,617. That’s where Ethereum would likely find its next meaningful buying interest. But reaching that level means a roughly 20% decline from the current support zone.
So Ethereum faces an asymmetric risk setup. Upside could stall around 11% near the supply wall. But downside risk activates with just a 1% support break and could extend to 20% losses. That’s not a favorable risk-reward ratio for buyers right now.
Momentum Weakening But Not Reversing Yet
The RSI momentum indicator shows selling pressure losing steam. That’s visible through the hidden bullish divergence mentioned earlier. When price makes lower lows but RSI doesn’t follow, momentum typically shifts.
However, momentum fading doesn’t equal momentum reversing. Ethereum still trades below key moving averages and remains inside a downtrend structure. The triangle pattern itself reflects indecision, not conviction.
For a real momentum reversal, Ethereum needs to reclaim the $3,179 resistance with volume. That would confirm buyers regained control. Without that confirmation, any bounce from triangle support likely gets sold into at the supply wall.
Plus, the triangle’s narrowing shape means this decision comes soon. Compressed price action inside contracting patterns typically leads to sharp breakouts. The direction of that breakout determines whether Ethereum recovers or accelerates lower.
What Happens Next Depends on $2,801
The entire setup hinges on that $2,801 support level. Hold above it, and Ethereum gets another shot at bouncing toward $3,149. Break below it, and the path toward $2,617 opens quickly.
That 1% margin between current price and critical support makes this a high-risk moment. Small moves trigger big consequences. And with the triangle squeezing price action tighter each day, that trigger could come faster than expected.
Traders watching this setup should focus on daily closes, not intraday wicks. A brief dip below $2,801 that recovers by close doesn’t count. But a confirmed daily close underneath likely brings sustained selling pressure.
Ethereum’s rebound hope exists through that hidden divergence signal. But the supply wall overhead and thin support underneath create an unfavorable setup. This isn’t a clear buy-the-dip opportunity. It’s a fragile balance that could tip either direction with minimal warning.
Watch that $2,801 level closely. The next move probably starts there.