
Ethereum just hit a critical inflection point. The second-largest cryptocurrency by market cap now faces two wildly different scenarios, and the margin between them is razor-thin.
ETH sits trapped between pattern breakdown risk and short squeeze potential. Meanwhile, on-chain data reveals exactly who’s selling and why. Let’s unpack what’s actually happening beneath the price action.
The Bearish Setup Everyone’s Watching
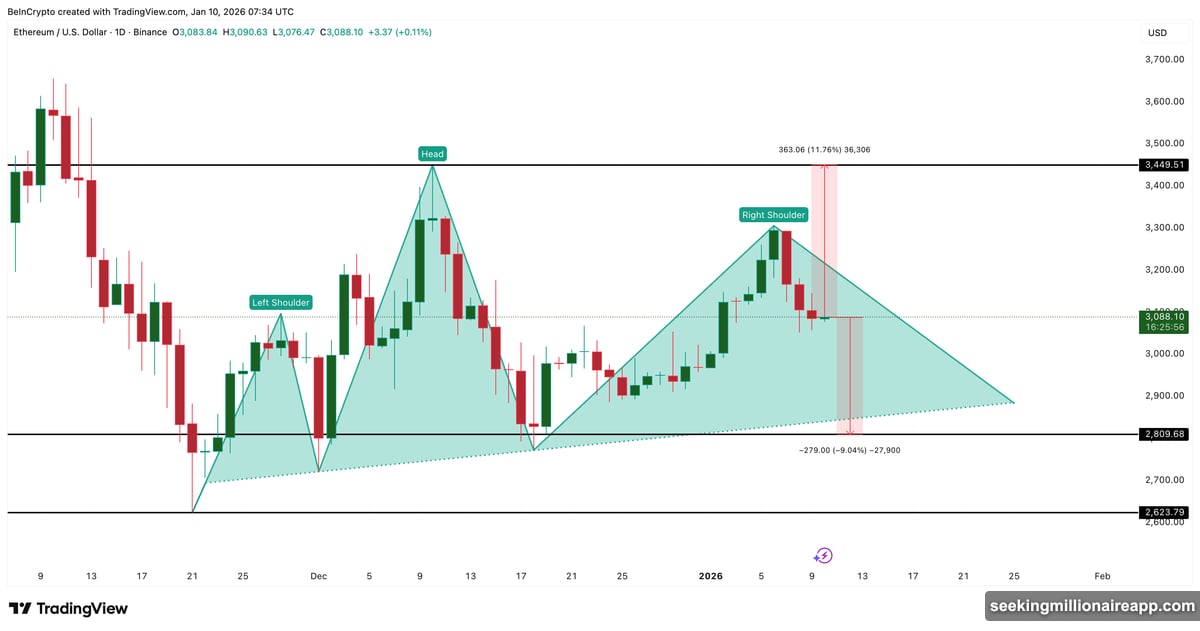
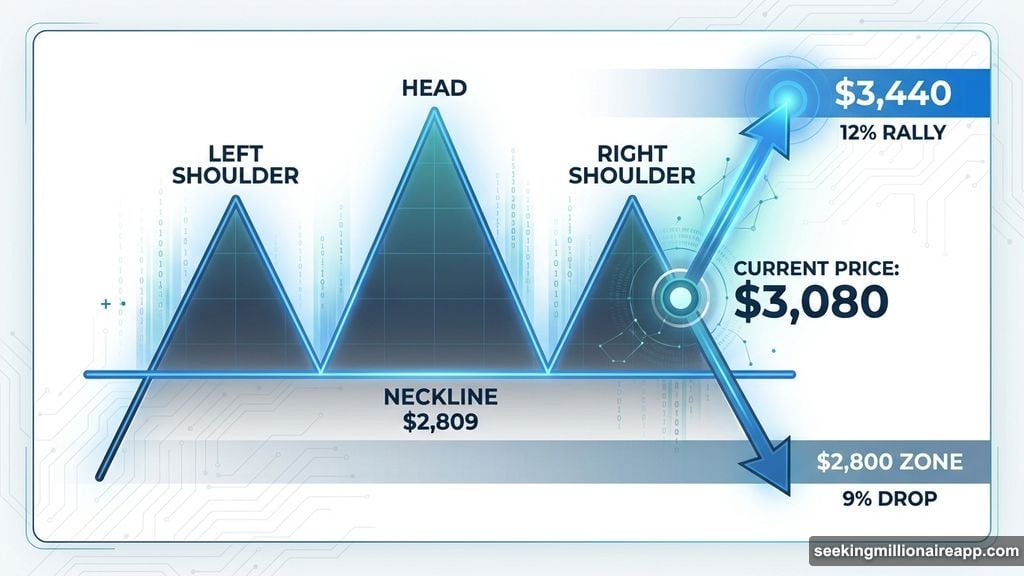
Ethereum’s daily chart shows a textbook head-and-shoulders pattern forming. This classic bearish structure consists of three peaks: a left shoulder, a higher central peak (the head), and a lower right shoulder.
The neckline sits around $2,809. A daily close below that level would confirm the pattern and trigger roughly 9% downside from current levels near $3,080. That would push ETH toward the $2,800 zone.
But here’s the twist. Breaking the pattern upward requires about 12% upside. A move past $3,440 would invalidate the entire formation and flip the technical outlook bullish.
So Ethereum trades in a narrow band where both outcomes remain possible. The question isn’t which pattern exists, but which direction breaks first.
Momentum Quietly Turned Against Bulls
Technical indicators reveal weakening strength beneath recent price action. The Relative Strength Index (RSI) measures momentum by comparing the magnitude of recent gains to recent losses.
Between early December and early January, RSI formed a higher high while Ethereum price made a lower high. This “hidden bearish divergence” signals fading bullish momentum even before price confirms weakness.
Since then, ETH pulled back, and no bullish divergence has emerged. That keeps breakdown risk active rather than resolved. Momentum hasn’t shifted back in bulls’ favor yet.
However, momentum is just one piece. Understanding who’s selling and who’s buying matters more for predicting which way price breaks.
Short-Term Holders Dumped Nearly Half Their Stack
On-chain data exposes the source of recent selling pressure. HODL Waves breaks Ethereum supply into cohorts based on holding period. This reveals which investor groups are moving coins.
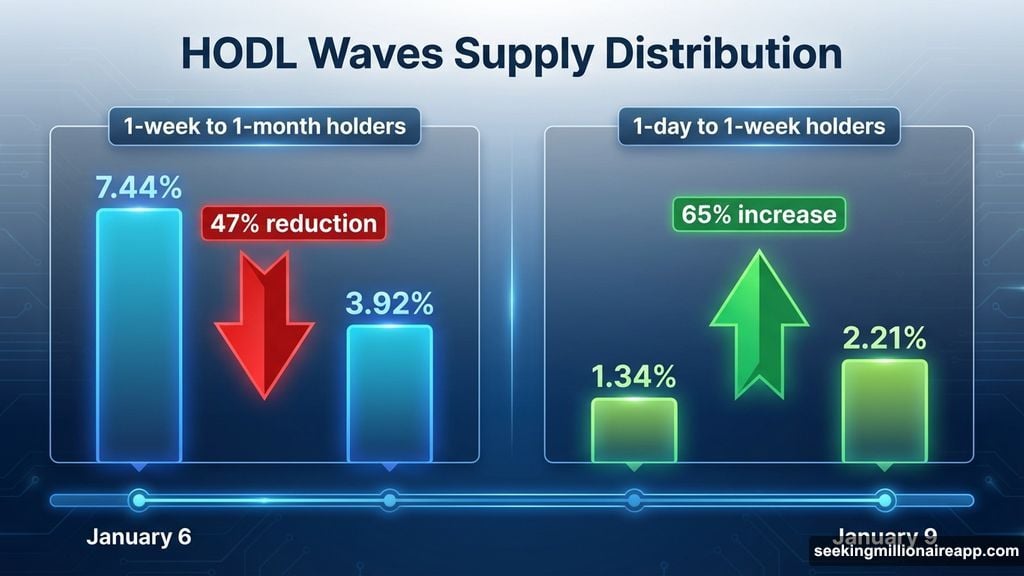
Between January 6 and January 9, the 1-week to 1-month cohort collapsed. Their supply share dropped from 7.44% to 3.92%, a 47% reduction in just three days. That’s massive distribution from relatively new buyers.
At the same time, the 1-day to 1-week cohort surged. Their share jumped from 1.34% to 2.21%, a 65% increase. This group represents fresh buyers who typically sell quickly on any price movement.
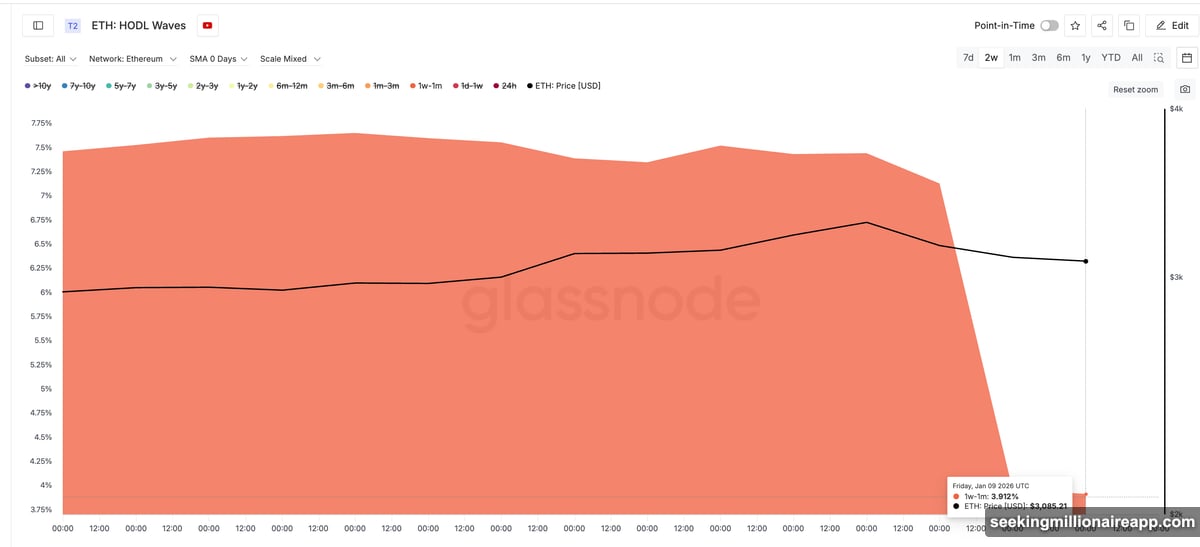
Translation? Short-term holders are rotating out aggressively. Meanwhile, new buyers replacing them have weak hands. That creates downside vulnerability.
Long-Term Buyers Slowed Down 24%
Long-term holder behavior also weakened, though more subtly. The Hodler Net Position Change metric tracks whether committed holders are accumulating or distributing.
This metric remains positive, meaning long-term holders still buy more than they sell. But the rate of accumulation dropped sharply. Net inflows fell from roughly 179,000 ETH on January 4 to about 135,500 ETH by January 9.
That’s a 24% decline in long-term buying pressure within five days. Long-term holders haven’t turned sellers. They’ve just stopped buying as aggressively.
Why does this matter? Strong long-term accumulation provides price support during corrections. When that support weakens, downside moves meet less resistance. The safety net is fraying, not disappearing.
Derivatives Market Screams Short Squeeze Risk
Futures positioning reveals a heavily tilted market. On major perpetual swap platforms, cumulative short liquidation exposure stands near $3.38 billion. Long exposure sits around $1.57 billion.
Do the math. Short positioning outweighs longs by roughly 115%. The market is aggressively betting on lower prices.
This creates asymmetric risk. Crowded short positions fuel violent upside moves when price starts rising. Forced short covering generates automatic buying pressure through liquidations.
That phenomenon, called a “short squeeze,” can push prices far beyond fundamental levels simply because shorts must buy to close positions. The more crowded the short side, the more explosive potential squeezes become.
Three Price Levels That Decide Everything
Ethereum currently trades near $3,080. Three critical zones determine which scenario plays out.
First, $3,050 provides immediate support. Multiple prior touches established this level as a key inflection point. Loss of $3,050 opens the door to $2,890.
Below that, $2,809 becomes the make-or-break level. A daily close beneath $2,809 completes the neckline break and confirms the bearish pattern. That would target the full 9% projected decline.
On the upside, $3,300 is first resistance. A daily close above that level weakens the right shoulder formation and puts bears on notice.
But $3,440 is the real battleground. A sustained move above that zone fully invalidates the head-and-shoulders pattern and likely triggers mass short liquidations. That aligns perfectly with the 12% rebound scenario.
What Tips the Balance?
Ethereum sits in a uniquely balanced spot. Spot market data shows weakening holder conviction and active short-term selling. That supports the bearish case structurally.
Yet derivatives positioning creates explosive rebound potential if price catches shorts off guard. With short exposure more than double long exposure, even a modest rally could cascade into a significant squeeze.
The next decisive move depends on who loses conviction first. Will short-term holders keep selling and push ETH through $3,050? Or will shorts panic and fuel a run toward $3,440?
Neither outcome is certain. But the setup is clear. Ethereum won’t stay in this range much longer.
Choose your risk carefully. The 9% downside and 12% upside scenarios sit remarkably close together. Whichever breaks first will likely move fast, and positioning on either side carries real consequences.