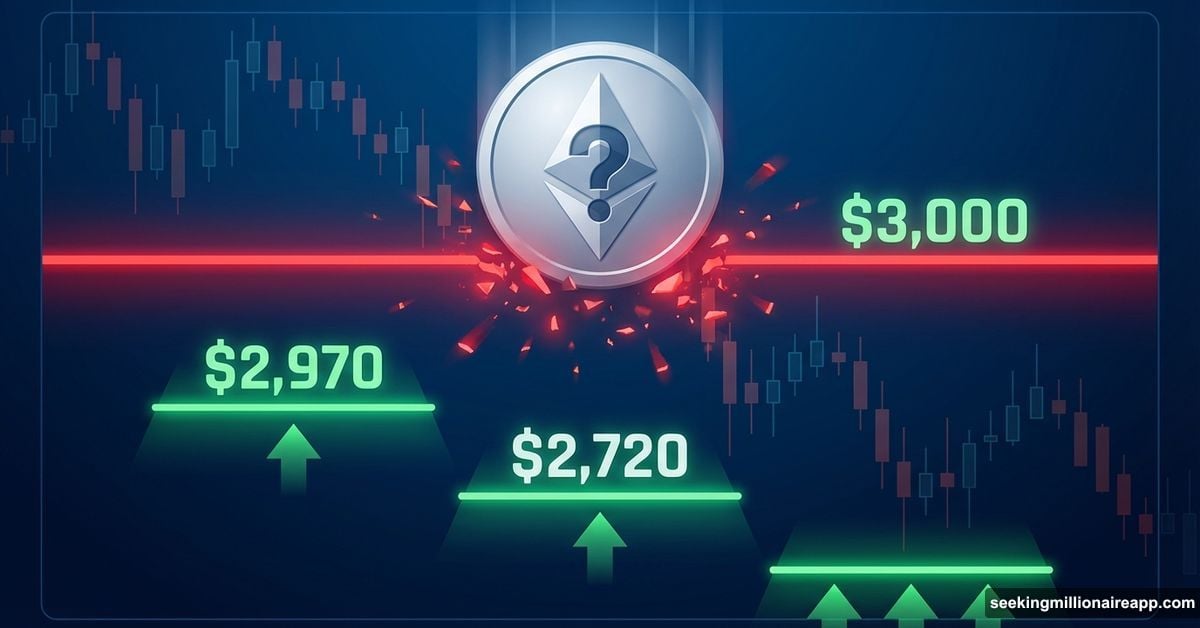
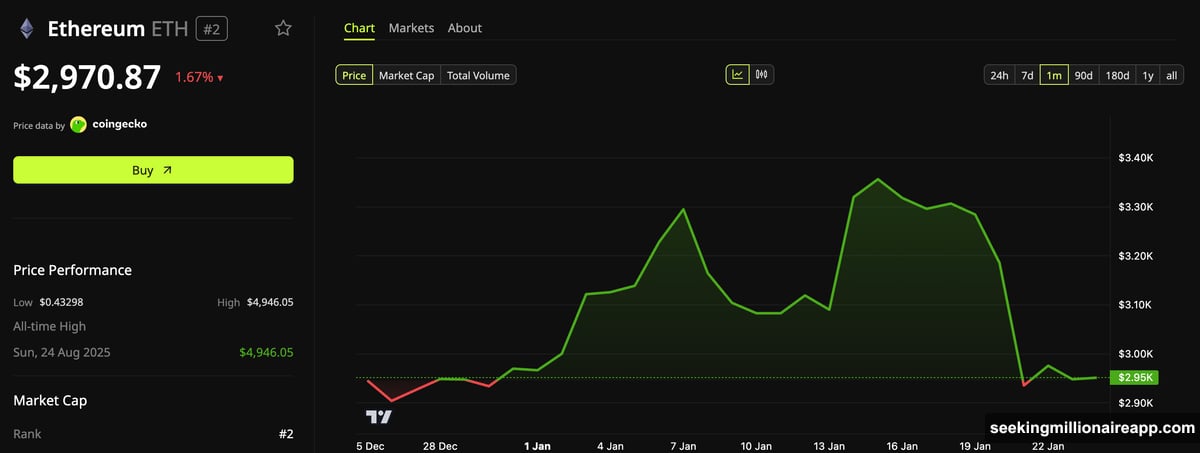
Ethereum briefly touched $3,000 yesterday. Then it fell back down. Now traders are asking the obvious question: where’s the floor?
The second-largest cryptocurrency dropped 1.67% in the past 24 hours. At press time, ETH traded at $2,970.87. That’s enough to make bulls nervous and bears cautious.
But here’s the interesting part. Multiple analysts are pointing to specific price levels where Ethereum might finally catch support. Their methods differ—on-chain data, technical patterns, historical cycles—yet several scenarios are emerging that suggest ETH could be approaching a critical turning point.
Whale Cost Basis Points to $2,720 Support
On-chain data reveals something fascinating about large holders. They’re still buying, not selling.
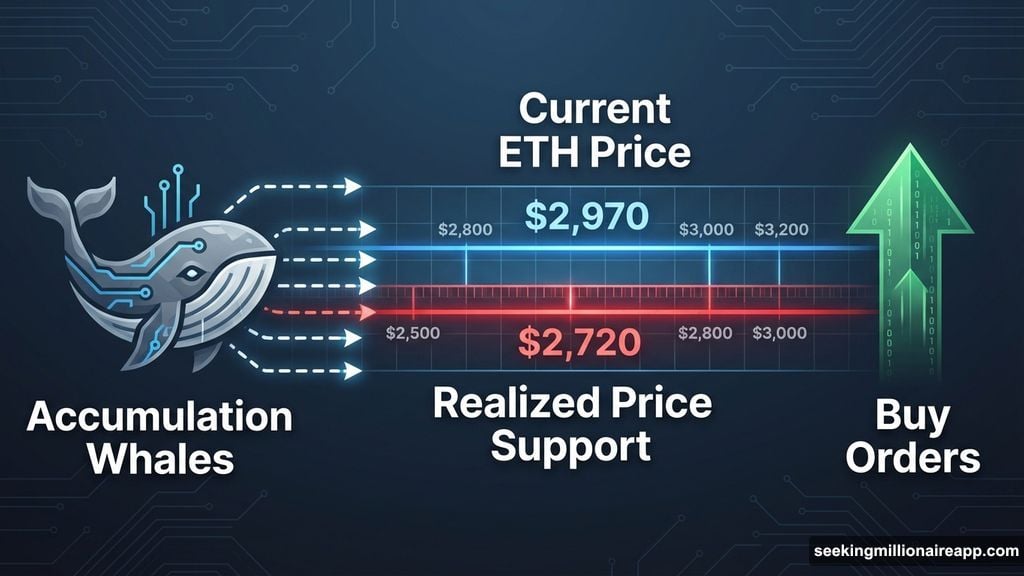
CryptoQuant analyst CW8900 noticed that the realized price of Ethereum accumulation addresses keeps climbing. This metric tracks the average cost at which long-term holders acquired their ETH. Currently, it’s approaching the spot market price.
Translation? Whales are adding to positions at current levels. Plus, historical data shows they tend to defend this cost basis aggressively.
“Furthermore, the realized price is a strong support level for accumulation whales,” CW8900 explained. Ethereum has never traded below this threshold for extended periods. That’s because whales typically step in with buy orders when price approaches their entry point.
Based on this pattern, CW estimates Ethereum’s potential bottom around $2,720. That’s roughly 7% below current prices. Not a dramatic fall, but enough to shake out weak hands before a potential reversal.
Technical Patterns Suggest Rounded Bottom Formation
Trader Kamran Asghar spotted something rare on the charts. According to his analysis, ETH just formed its third “huge weekly rounded bottom.”
Why does this matter? The previous two formations preceded significant price rallies. Rounded bottoms typically signal exhaustion of selling pressure and gradual accumulation by confident buyers.
Meanwhile, analyst Bit Bull identified a double bottom structure on higher timeframes. He also noted an inverse head-and-shoulders pattern forming on the monthly chart. Both are classic bullish reversal signals in technical analysis.
“I think ETH will surprise everyone in 2026,” Bit Bull remarked. His confidence stems from these long-term structural patterns that often take months to fully develop but can lead to sustained uptrends once confirmed.
The 3.5-Year Cycle Theory Points to New Phase
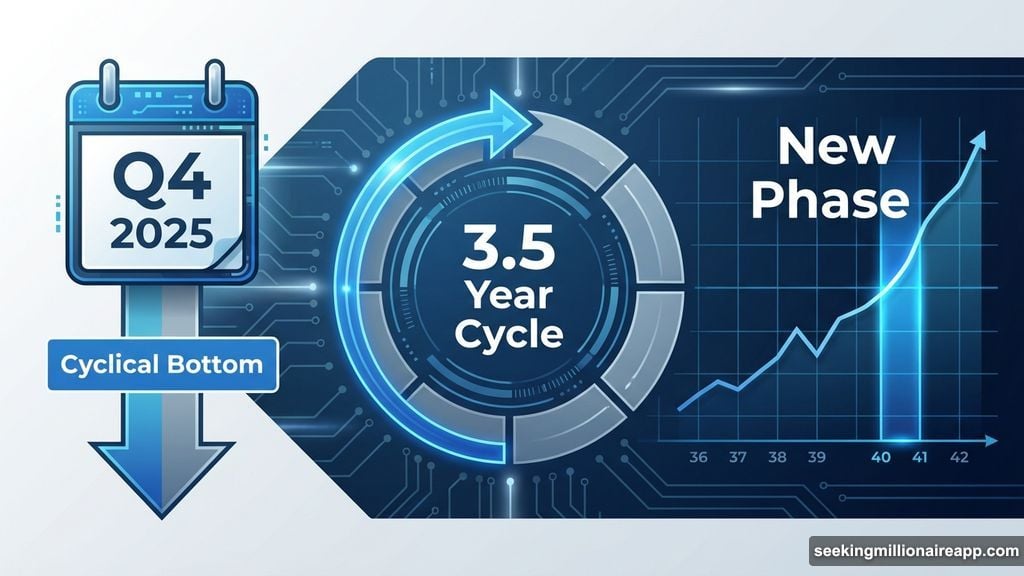
Analyst Matthew Hyland takes a different approach. He argues Ethereum follows a 3.5-year market cycle, not Bitcoin’s four-year halving pattern.
According to his framework, Ethereum’s cyclical bottom formed in Q4 2025. Now, the asset is transitioning into the early stages of a new cycle. Historical data supports this view—ETH typically bottoms around months 40-42 after making new all-time highs.
“The next cycle for ETH has begun,” Hyland stated. His analysis suggests the brutal decline phase has concluded. What comes next could be a gradual basing period before the next major leg up.
Short-Term Volatility Remains High
Not everyone’s bullish right now. Analyst Ted Pillows warned that ETH faces a critical test near $3,000 to $3,050.
A successful move above this range could open the path toward $3,200. But failure to reclaim these levels might expose Ethereum to new yearly lows. Geopolitical tensions continue to drive volatility across crypto markets, making short-term price action unpredictable.
So ETH sits at an inflection point. Bulls point to on-chain support, technical patterns, and cycle theory. Bears cite resistance overhead and broader market uncertainty.
What This Means for Ethereum Holders
Several indicators suggest Ethereum could be approaching an important bottom. Whale cost basis near $2,720 provides one potential floor. Technical patterns point to reversal structures forming on weekly and monthly charts. And cycle analysis indicates the worst may already be behind us.
But here’s the catch. None of this guarantees immediate upside. Bottoming is a process, not an event. Ethereum could consolidate at these levels for weeks or even months before making a decisive move.
Smart money seems to be accumulating quietly. On-chain data shows whales adding positions rather than exiting. That’s usually a good sign for medium-term holders.
Still, volatility persists. Anyone holding or buying ETH should prepare for continued price swings. The path forward likely involves grinding higher from a solid base rather than explosive V-shaped recovery.
Ethereum’s next major move could define its trajectory for the rest of 2026. Whether it finds support at $2,720 or tests lower levels first, the setup is developing. Watch how price reacts at these key zones. That’ll tell you everything you need to know about ETH’s near-term direction.