
Ethereum looked ready to run. The chart showed a textbook breakout. Whales were buying aggressively. Then everything collapsed in less than two weeks.
This wasn’t random volatility. A massive supply wall quietly absorbed all demand and turned what looked like a bullish setup into a brutal trap. Now ETH sits 16% below its recent highs, and the damage goes deeper than most realize.
The Breakout That Hit a $4 Billion Wall
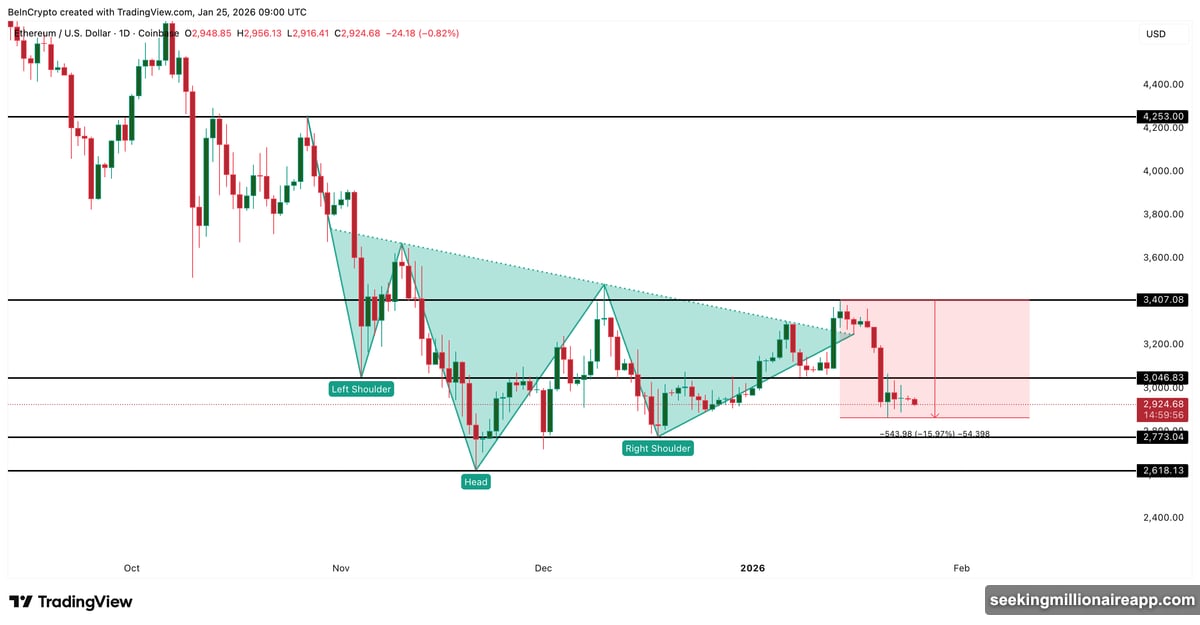
Ethereum’s inverse head-and-shoulders pattern started forming back in October. By January 13, the price finally pushed above the neckline with real conviction. Technical traders saw confirmation. Momentum was building. Everything pointed toward continuation.
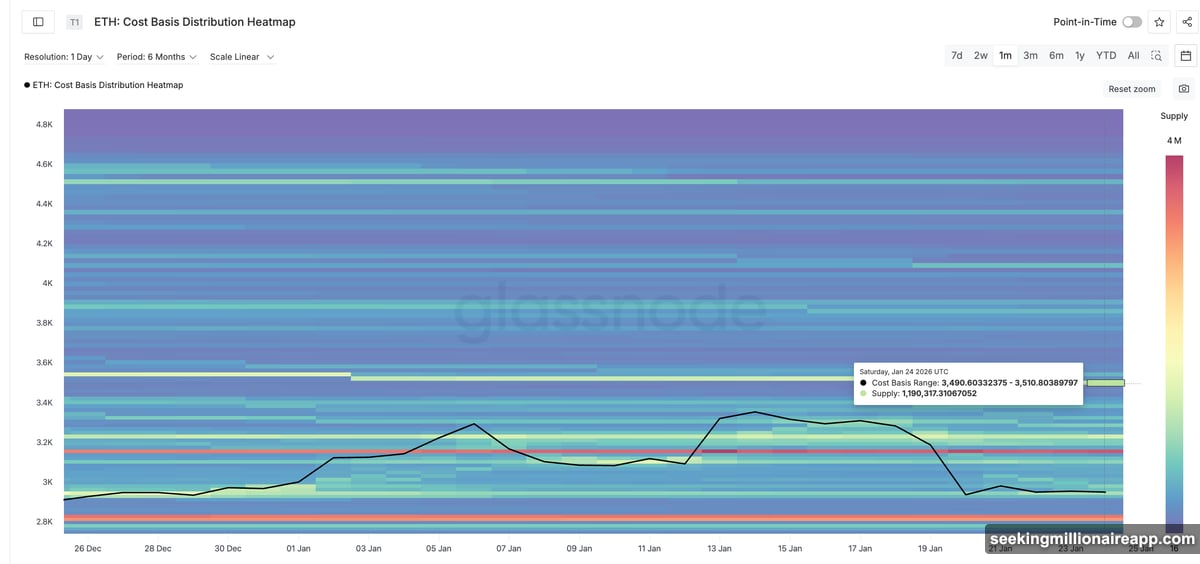
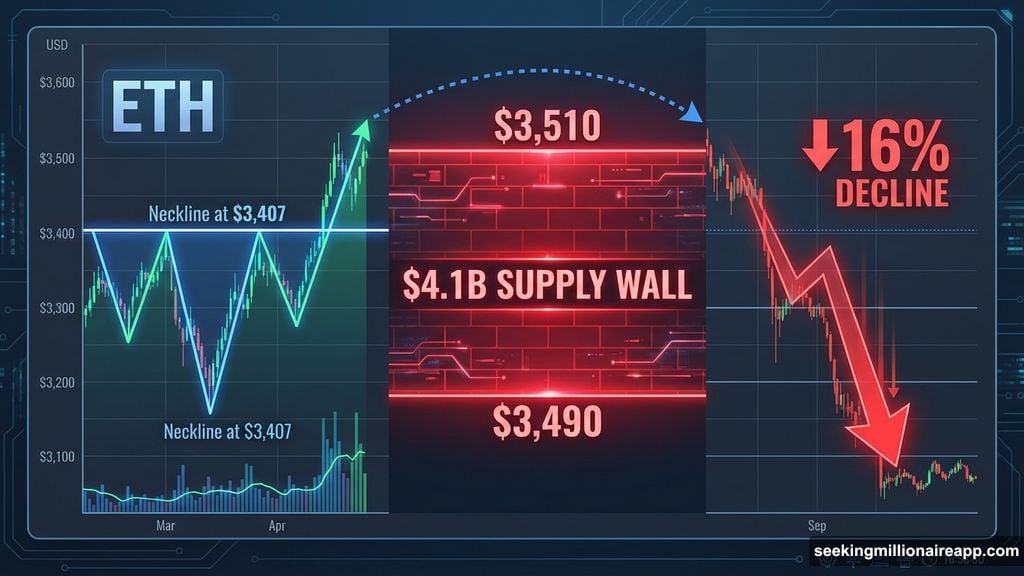
But the rally stalled hard near $3,407. Why? A dense cluster of previous buyers sat just overhead.
On-chain data reveals roughly 1.19 million ETH was accumulated between $3,490 and $3,510. At current prices, that represents about $4.1 billion in supply. This kind of cost-basis wall forms when large amounts get bought in a tight range. When price revisits that zone, holders often sell to break even.
So Ethereum pushed close to this wall, lost momentum, and rolled over. The breakout held briefly on paper. But structurally, it was already compromised. The overhead supply was simply too heavy to absorb.
Whales Bought Heavily and Still Got Trapped
Here’s what makes this setup particularly dangerous. Large holders did exactly what bullish investors are supposed to do. Starting January 15, right after breakout confirmation, whale balances climbed steadily.
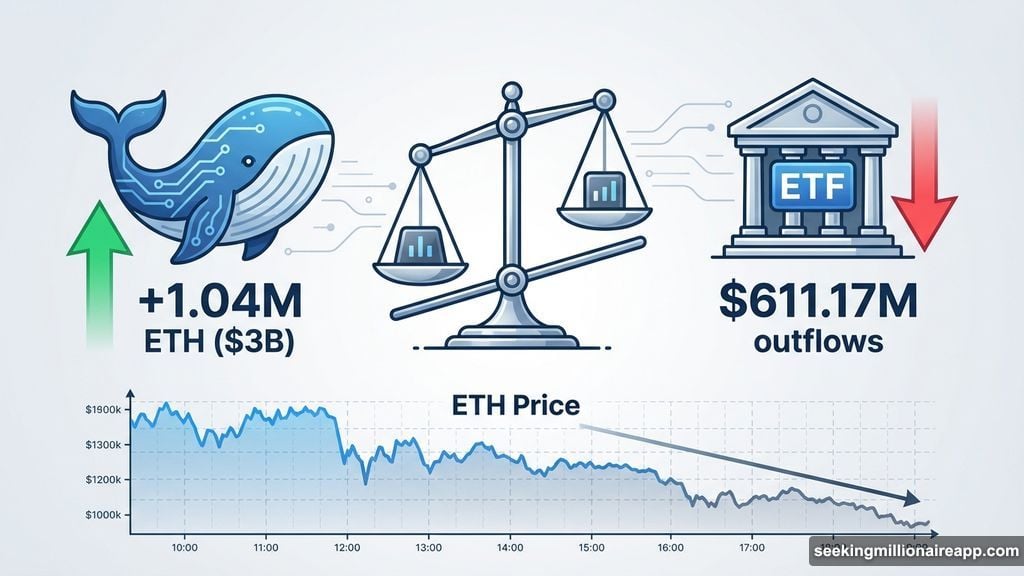
ETH whale holdings increased from roughly 103.11 million to 104.15 million tokens. That’s an addition of about 1.04 million ETH, worth close to $3 billion. Moreover, this buying continued even as price started declining, showing clear averaging behavior.
Normally, whale accumulation like this supports price. Not this time. The problem came from outside the on-chain data.
ETF flows flipped dramatically. The week ending January 16 saw strong inflows that helped fuel the breakout. Then the next week, ending January 23, recorded net outflows of $611.17 million.
That shift mattered enormously. ETF selling added steady directional pressure exactly as Ethereum tested major resistance. So whale buying met institutional selling. Plus, both collided with that massive supply wall. The result? Even large holders got trapped above support as price slid lower.
This explains why the correction persisted despite accumulation. Demand existed, mostly from whales. But supply was heavier. The wall won decisively.
Critical Levels That Determine ETH’s Next Move
Ethereum is now back inside the previous range, and the structure looks weak. On the downside, $2,773 emerges as the critical level to watch. A daily close below this zone would break the right shoulder of the inverse head-and-shoulders pattern.
That would confirm the bull trap fully. It would also threaten the $2,819 to $2,835 cost-basis cluster. While this zone represents heavy demand that can absorb selling, losing it would expose Ethereum to accelerated downside. Below that, support weakens quickly.
On the upside, recovery must happen in stages. First, Ethereum needs to reclaim $3,046. That would stabilize price somewhat. But it’s not nearly enough for real confirmation.
The actual test sits at $3,180. Breaking cleanly above this level would flip the $3,146 to $3,164 supply zone. Only then would you see real demand returning with conviction.
Yet even then, serious resistance remains. The larger sell wall around $3,407 to $3,487 still dominates the chart. That’s the same zone that rejected the breakout and triggered this entire correction.
Until Ethereum clears those levels cleanly, any rallies remain vulnerable to reversal. Bulls need more than whale buying. They need that supply wall to get absorbed or cleared entirely.
Why This Failed Despite Everything Looking Right
Ethereum didn’t fail because buyers were weak or sentiment turned bearish. It failed because supply overwhelmed demand at a critical moment. The setup looked perfect from a technical standpoint. Whales were accumulating aggressively. But none of that mattered when $4 billion in overhead supply met heavy ETF outflows.
This kind of trap hurts because it punishes investors who followed the signals correctly. The breakout was real. The pattern was valid. Whale buying was substantial. Yet institutional flows and cost-basis resistance aligned perfectly to reverse everything.
So what comes next? Ethereum must reclaim $3,180 convincingly or risk deeper downside below $2,773. Until those supply walls get cleared, the bull trap remains active. And whales who bought the breakout are now sitting on losses, waiting for either recovery or capitulation.
The market didn’t change direction randomly. It hit a wall that was always there, just waiting.