
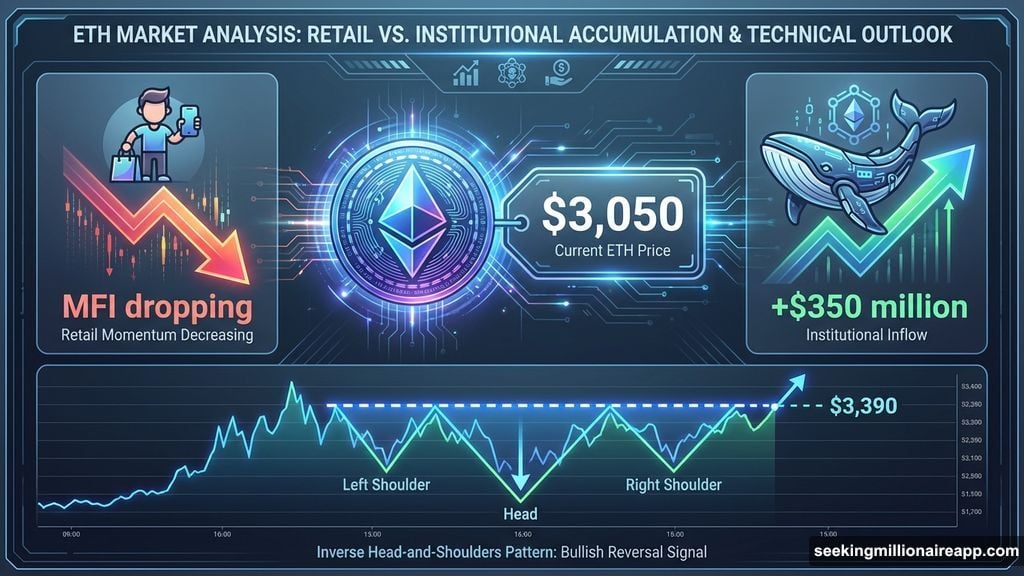
Ethereum’s price barely moved. Down less than 1% over 24 hours. Most retail traders ignored it.
Meanwhile, crypto whales silently accumulated $350 million worth of ETH. Plus, one technical indicator just flashed a rare bullish signal that typically precedes major price moves.
So what do whales see that retail traders don’t? Let’s dig into the data.
Retail Traders Hesitate While Whales Load Up
Ethereum’s chart shows a classic inverse head-and-shoulders pattern forming. This technical structure often signals a trend reversal from bearish to bullish. The pattern completes if price breaks above $3,390.
But here’s the problem. Retail momentum collapsed right before the potential breakout.
Between December 18 and December 24, ETH price made a higher low. Normally that’s bullish. However, the Money Flow Index (MFI) made a lower low during the same period. That disconnect reveals weak buying pressure from retail traders.
Think of MFI as a tracker for money flowing in and out of an asset. When price rises but MFI drops, it means fewer buyers support the move. That’s exactly what happened last week.
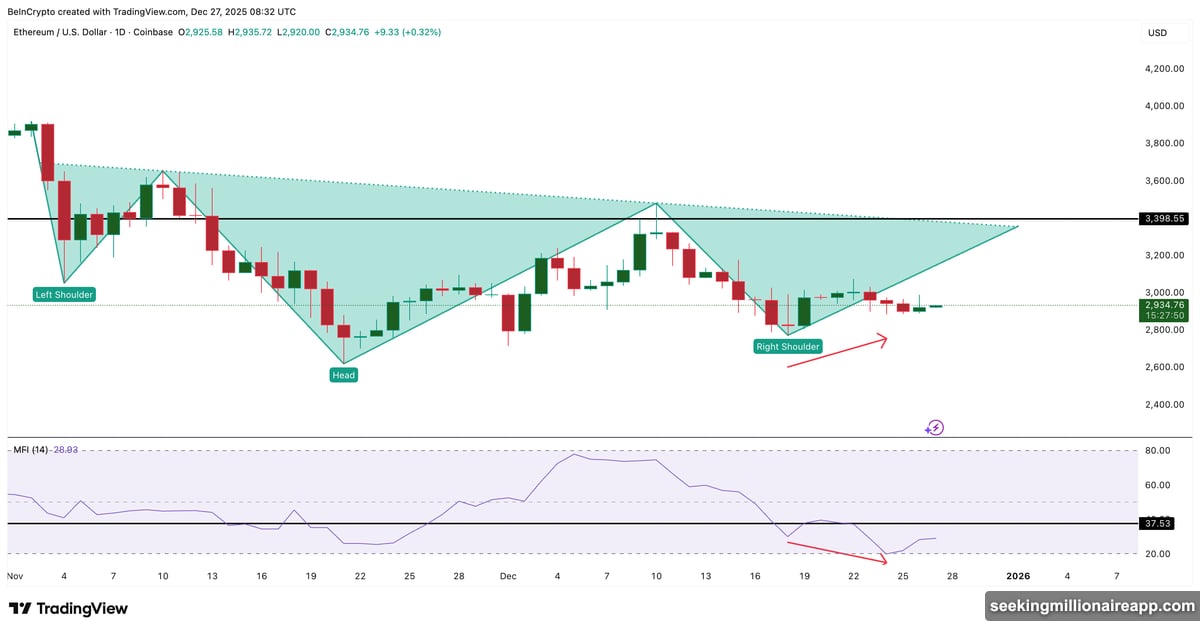
Now MFI needs to climb above 37 to confirm stronger demand. Until then, retail interest remains soft.
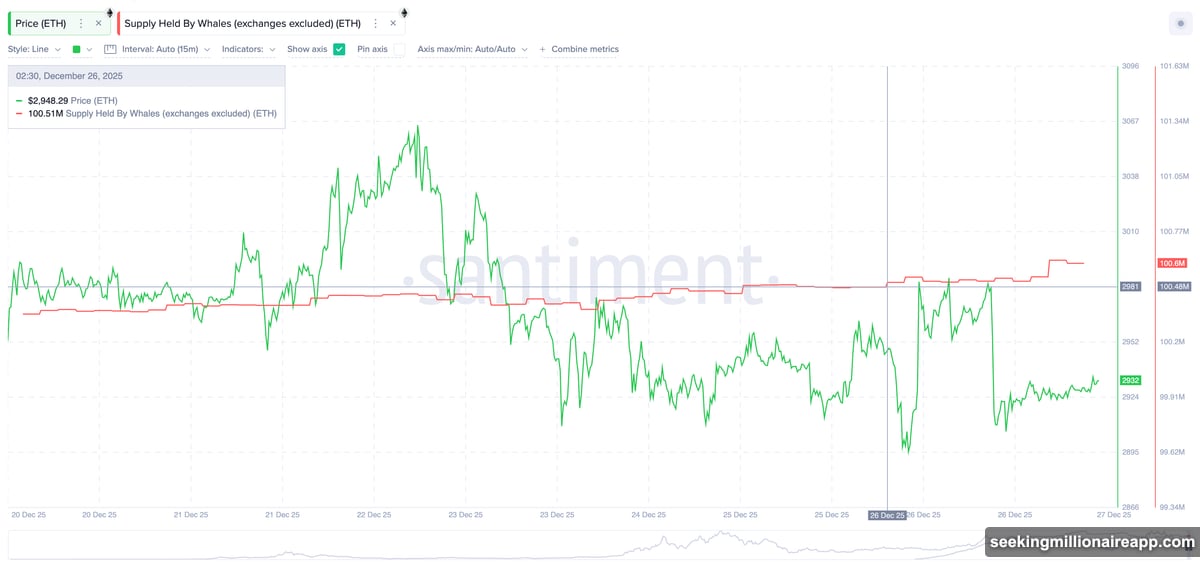
Whales acted completely differently. Since December 26, large wallets increased their holdings from 100.48 million ETH to 100.6 million ETH. At current prices, that represents roughly $350 million deployed in just 24 hours.
Whales don’t chase short-term pumps. They accumulate when they spot favorable setups. So their buying spree suggests they’re positioning for something bigger.
One Momentum Indicator Supports The Whale Thesis
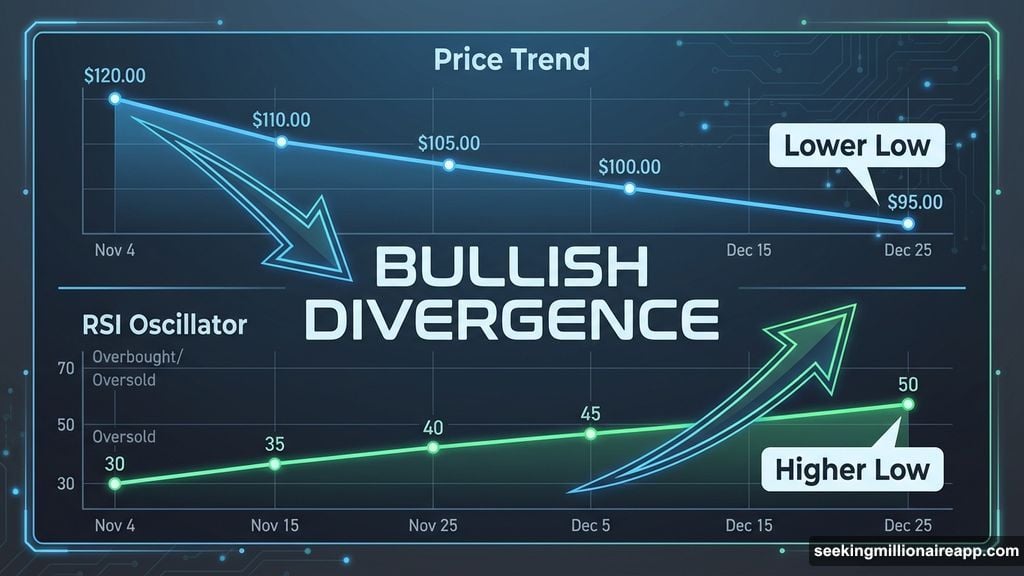
The Relative Strength Index (RSI) backs up the whale accumulation strategy. This momentum oscillator revealed a bullish divergence pattern that technical traders watch closely.
Between November 4 and December 25, price made a lower low. Yet RSI made a higher low during that same period. This divergence signals that selling pressure is weakening even though price hasn’t confirmed the shift yet.
Bullish divergences often precede trend reversals. They don’t guarantee breakouts. But they increase the probability that reversal patterns like inverse head-and-shoulders actually trigger successfully.
That timing explains why whales started accumulating now. They’re betting the technical setup pays off.
Moreover, this type of divergence works best when combined with a clear chart pattern. Ethereum has both elements aligning simultaneously. The inverse head-and-shoulders provides the structure. The RSI divergence provides the momentum confirmation.
Retail traders often miss these subtle shifts. Whales rarely do.
Critical Price Levels Determine What Happens Next
Ethereum needs to reclaim $3,050 first. This psychological level acts as immediate resistance. Breaking above it with strong volume would signal renewed bullish momentum.
After $3,050, the next major test sits at $3,390. That’s the neckline of the inverse head-and-shoulders pattern. A clean break above this level could trigger the pattern’s measured move target near $4,400.
How did I calculate $4,400? Take the distance from the head’s low point to the neckline. Then add that distance to the breakout point. That gives the technical target if the pattern completes successfully.
However, losing $2,800 on the downside changes everything. That level represents critical support. Breaking below it would weaken bullish momentum significantly.
If selling pressure increases and whales stop accumulating, ETH could slide to $2,620. Dropping below that level would invalidate the entire bullish reversal structure. Then traders would need to reassess their outlook completely.
Why This Split Between Retail And Whales Matters
Retail traders focus on short-term price action. They react to what already happened. When they see flat or slightly negative moves, they often sit on the sidelines.
Whales analyze structural setups. They position before obvious breakouts occur. That’s why they’re buying now rather than waiting for confirmation above $3,390.
This behavioral split creates opportunity. But it also creates risk.
If whales are right, retail will chase ETH higher after the breakout confirms. That surge in late buying often pushes prices toward technical targets like $4,400. Early positioning pays off.
If whales are wrong, retail avoids losses by staying cautious. But historically, major market moves happen when large holders accumulate before retail notices.
The current setup favors patient positioning over reactive trading. Technical indicators support that view. The RSI divergence increases breakout probability. The inverse head-and-shoulders provides a clear roadmap.
Yet nothing is guaranteed. Markets change. Patterns fail. That’s why defined risk levels like $2,800 matter so much.
What Smart Traders Watch Next
Monitor three things over the coming days. First, does MFI climb above 37? That would confirm retail demand is strengthening to match whale accumulation.
Second, does price break cleanly above $3,050? This level needs to flip from resistance to support. Volume matters here. A low-volume break often fails quickly.
Third, watch whale wallet activity. If large holders continue adding through any dips, their conviction remains strong. If accumulation stops, the thesis weakens.
Ethereum sits at an inflection point. One side hesitates. The other side loads up aggressively. Technical indicators suggest the whales might be seeing something retail traders are missing.
But markets don’t care about our biases. They only respect defined levels and follow-through. The next few weeks will show which group positioned correctly.