
Ethereum is flashing a familiar technical signal. But this time, the setup underneath looks quite different.
ETH currently trades near $2,140, sitting about 48% below its January high of $3,400. Now, a bullish RSI divergence has returned on the daily chart. That same pattern triggered a roughly 25% rally earlier this month. So naturally, traders are paying attention.
But before getting too excited, it’s worth checking whether the supporting conditions actually match.
RSI Divergence Repeats a Familiar Pattern
Here’s what the chart is showing. Between January 25 and March 19, Ethereum’s price printed a lower low on the daily timeframe. Meanwhile, the relative strength index (RSI) formed a higher low near 38. That gap between price action and momentum is called a bullish divergence.
This exact same setup appeared between January 25 and March 8. And what followed? A roughly 25% rally.
So on the surface, the technical picture looks promising. The same momentum pattern is back, and price memory suggests a bounce could follow.
But derivatives data tells a more complicated story.
Open Interest Climbed, But Shorts Are Gone
Back on March 8, when the last RSI divergence fired, ETH’s total open interest sat at $9.42 billion. Funding rates were deeply negative at -0.017%. That meant the market was heavily short-positioned.
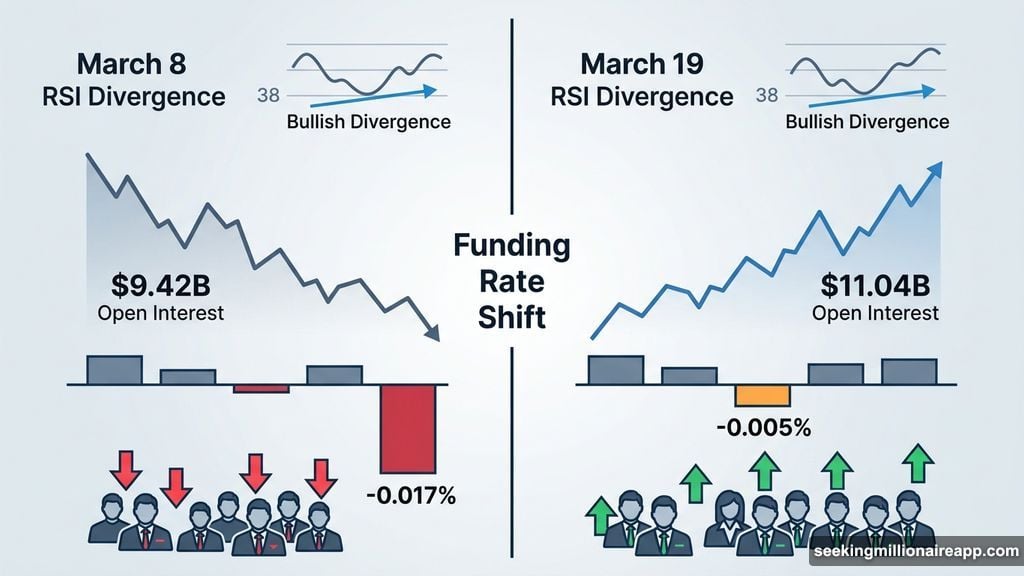
When prices started moving up, those shorts got squeezed. That short squeeze essentially turbocharged the 25% rally that followed.
The current setup is meaningfully different. Open interest has climbed 17% to $11.04 billion. But funding rates are now just -0.005%, far less negative than before. Fewer traders are actually short this time around.
Instead, the rising leverage looks like it reflects long-heavy positioning. And that changes the risk equation significantly. If price drops from here, it’s long positions facing liquidation pressure, not shorts getting squeezed out. So rather than a tailwind, leverage could become a headwind.
Spot Accumulation Is Telling a Different Story
Here’s where it gets interesting. While the derivatives picture looks shaky, on-chain data from Glassnode is flashing something much more encouraging.
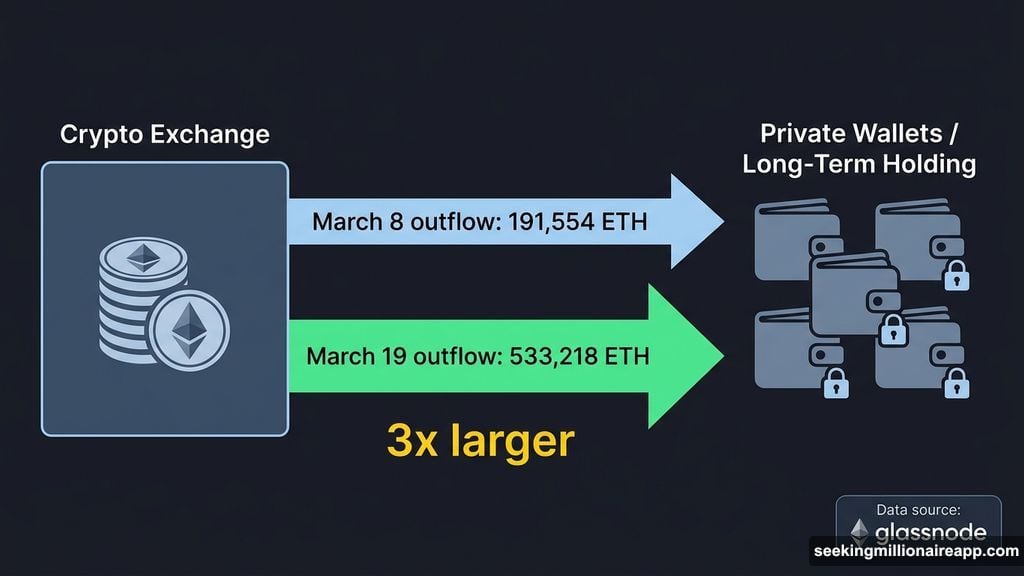
On March 19, Ethereum saw a net exchange outflow of 533,218 ETH. That’s the single largest daily outflow in over two weeks. When ETH leaves exchanges in large volumes like that, it typically means investors are moving tokens to private wallets for long-term holding. That’s a classic sign of spot accumulation.
Now compare that to March 8, when the previous RSI divergence appeared. The net outflow that day was just 191,554 ETH. The current figure is nearly three times larger.
That’s a meaningful signal. It suggests real buyers are stepping in at spot prices, not just traders playing leverage games. And a solid accumulation base can absorb a lot of selling pressure that would otherwise crack a more speculative rally.
So the divergence between spot and derivatives markets is the defining tension in ETH’s setup right now.
The $2,380 Level That Decides Everything
After the 48% drop from $3,400 down to a February 6 low near $1,740, ETH formed an ascending channel on the daily chart. That structure has been holding the price action since.
On March 16, ETH attempted to break above the channel’s upper trendline. It failed. Price pulled back toward the middle of the range, and that’s roughly where it sits today.
One important note here. Ascending channels that form after large drops aren’t automatically bullish. They can just as easily resolve to the downside if buyers don’t step up at the right moment.
The critical level to watch is $2,380. Reclaiming that price on a sustained basis would confirm a breakout above the channel and shift the short-term outlook bullish. That’s the line separating “bounce continues” from “story changes.”
If $2,380 doesn’t hold as a target, the next meaningful support sits at $1,990. A break below that level opens the door to $1,750, which aligns with both the 0.382 Fibonacci retracement level and the February lows.
Two Forces Pulling in Opposite Directions
The honest read on Ethereum right now is that two forces are competing. On one side, spot buyers are accumulating at a pace nearly three times stronger than the last rally’s setup. That’s real demand from real holders, not just leveraged traders chasing momentum.
On the other side, derivatives markets show long-heavy positioning without the short squeeze fuel that powered the March 8 move. If price slides, those longs unwind rather than accelerate a rally.
Which force wins depends on whether $2,380 gets reclaimed. Spot accumulation gives ETH a stronger foundation than it had before its last 25% move. But leverage risk means the path up is narrower and more fragile than raw chart pattern comparisons might suggest.
Watch that $2,380 level closely. It’s not just a number. It’s the answer to which side of this tug-of-war actually wins.