Nvidia just had a rough week. The stock closed above $165 on March 30, down over 9% since March 25 — and it’s now sitting directly on a chart level that could trigger another significant drop.
The culprit? A combination of AI memory market chaos and a surprise spending pullback from one of the biggest players in the space. But here’s the interesting part: not all the signals agree on where things go from here.
Google’s TurboQuant Rocked the AI Memory Market
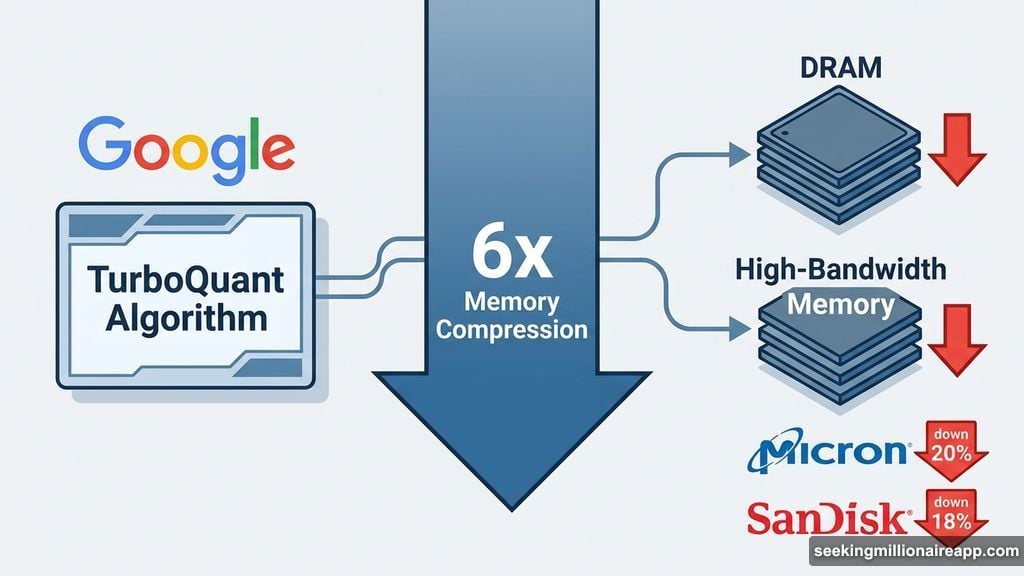
The sell-off traces back to March 24, when Google announced TurboQuant — a memory compression algorithm that cuts AI model memory requirements by 6x without any performance loss.
That news hit AI memory stocks hard. Micron dropped roughly 20%. SanDisk fell about 18%. And the pain spread fast.
Then OpenAI made things worse. Reports surfaced that the company is scaling back data center spending. That matters a lot because OpenAI’s October 2025 deal to secure 40% of global DRAM supply had been a cornerstone of the “memory shortage” investment thesis. Any pullback from that commitment weakens demand for high-bandwidth memory — which feeds directly into Nvidia’s GPU production pipeline.
Together, these two events dragged NVDA down to $165 by March 30.
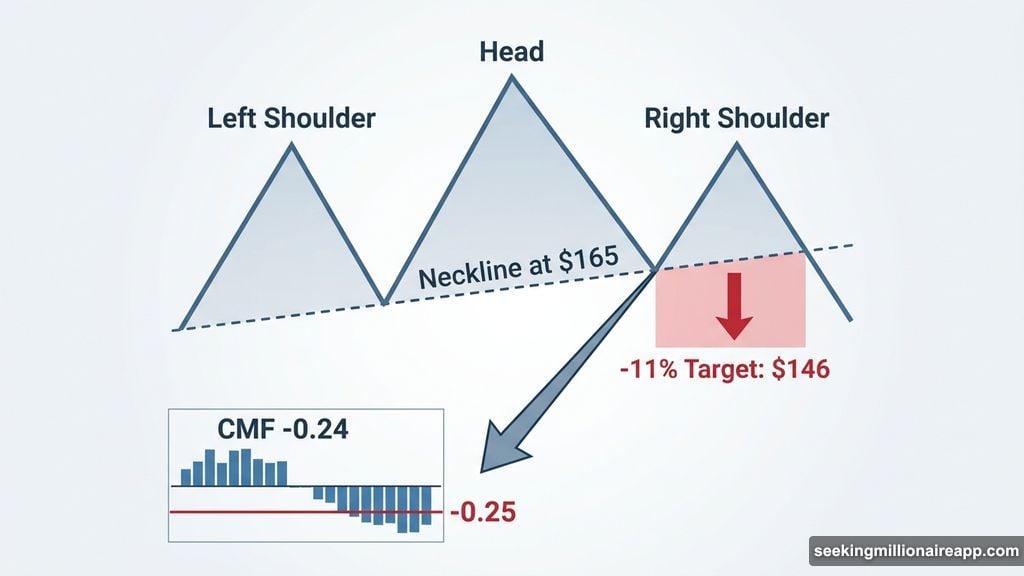
The Head-and-Shoulders Pattern Everyone’s Watching
So here’s where the chart gets tense. The drop pushed Nvidia right to the neckline of a head-and-shoulders pattern on the daily chart.
For anyone unfamiliar with chart patterns, a head-and-shoulders formation is a classic reversal signal. It shows a stock making three peaks — one higher center peak flanked by two shorter ones. When the price breaks below the “neckline” connecting the lows between those peaks, it typically signals more selling ahead.
In Nvidia’s case, if that neckline breaks, the measured downside target points to another 11% decline — putting the stock near $146.
The neckline here slopes downward, which actually makes a clean breakdown slightly harder to trigger. The price has to keep falling to reach it. But right now, NVDA is inches away.
Institutional Flows Aren’t Fully Bearish Yet
One thing giving bulls some hope is the Chaikin Money Flow (CMF) indicator. Think of CMF as a proxy for institutional buying and selling pressure — essentially, are big money players buying or selling more aggressively?
The CMF currently sits at -0.24. That’s close to negative territory, but it hasn’t crossed the key -0.25 threshold yet. Between February 5 and March 30, even as the stock trended lower, the CMF actually held higher — a sign of underlying support from institutional buyers.
However, watch that level closely. If CMF breaks below -0.25, it signals that institutional sellers are firmly in control, and a neckline breakdown becomes significantly more likely.
Options Traders Are Buying the Dip
Here’s the most surprising signal in the whole picture: options traders are actually turning more bullish as the stock falls.
On March 25, when the sell-off started, the put-call volume ratio sat at 0.89 — nearly balanced between bearish and bullish bets. By March 30, that ratio dropped 16.8% to 0.74. A falling put-call ratio on a stock down 9% in five sessions means call volume (bullish bets) expanded significantly relative to put volume.
That’s unusual. It suggests traders are using the weakness to build bullish positions rather than hedging for further pain.
UBS analyst Timothy Arcuri may be influencing some of that thinking. He reiterated a Buy rating on Nvidia with a $245 price target on March 20 — just five days before the sell-off began. His view treats the memory supply disruption as a short-term headwind, not a structural shift. The 48% implied upside from current levels is hard to ignore.
Key Price Levels to Track
Right now, Nvidia trades below all four of its major exponential moving averages (EMAs) — weighted trend indicators that help identify directional momentum.
The 20-day EMA sits at $177. The 50-day and 100-day EMAs both cluster around $181. The 200-day EMA sits at $174, which closely aligns with the 0.618 Fibonacci retracement level at $174. That $173-$174 zone is the critical reclaim target for bulls.
The 50-day and 100-day EMA completed a bearish crossover during the final week of March, adding longer-term downside pressure. That’s the kind of signal that makes institutional risk managers nervous.
Here’s how the key scenarios break down:
- Hold above $165: Immediate neckline threat neutralized
- Reclaim $174: Back above the 200-day EMA, opens path toward $183 and $188
- Above $188: UBS’s $245 target starts looking credible
- Break below $165: Head-and-shoulders confirms, 11% measured move targets ~$146
Two Conflicting Stories, One Stock
What makes Nvidia’s setup fascinating right now is how much the signals disagree. The price chart and money flow data lean bearish. The options market leans bullish. And Wall Street analysts are holding firm on big upside targets.
If Nvidia bounces off the neckline, all those call options become very valuable very fast — and a short squeeze could amplify the move higher. But if the neckline breaks? Those same call buyers face rapid losses, and the unwinding could accelerate the drop.
The next few trading sessions will likely decide which story wins. A confirmed close above $174 changes the narrative significantly. Failing to hold $165 confirms the bears are in charge.
Either way, Nvidia hasn’t been at a more critical technical crossroads since early 2026.