Pi Coin just broke through a critical price level. Traders call it a “doomsday” pattern for good reason.
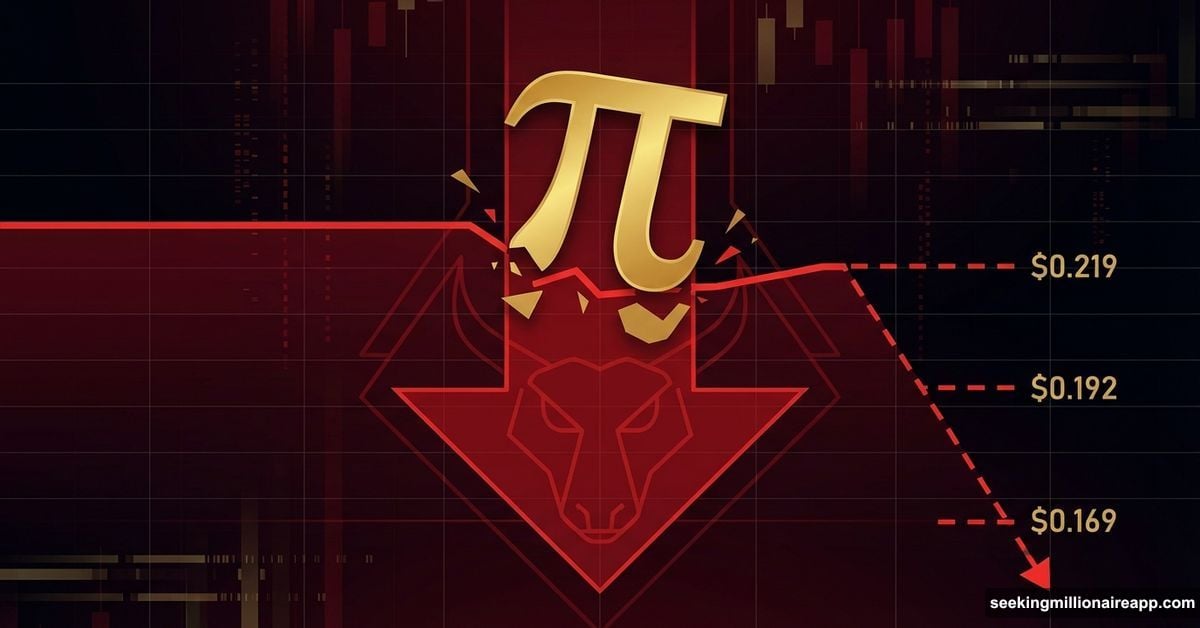
The token dropped below $0.219 this week, confirming a bearish head and shoulders formation. That breakdown typically triggers further selling. Plus, the projected target sits at $0.169—below Pi’s current all-time low of $0.172.
But here’s the twist. Two technical indicators show buyers still fighting back despite the breakdown. Money flow data and momentum signals reveal hidden strength that could prevent a complete collapse.
The Pattern That Nobody Wanted to See
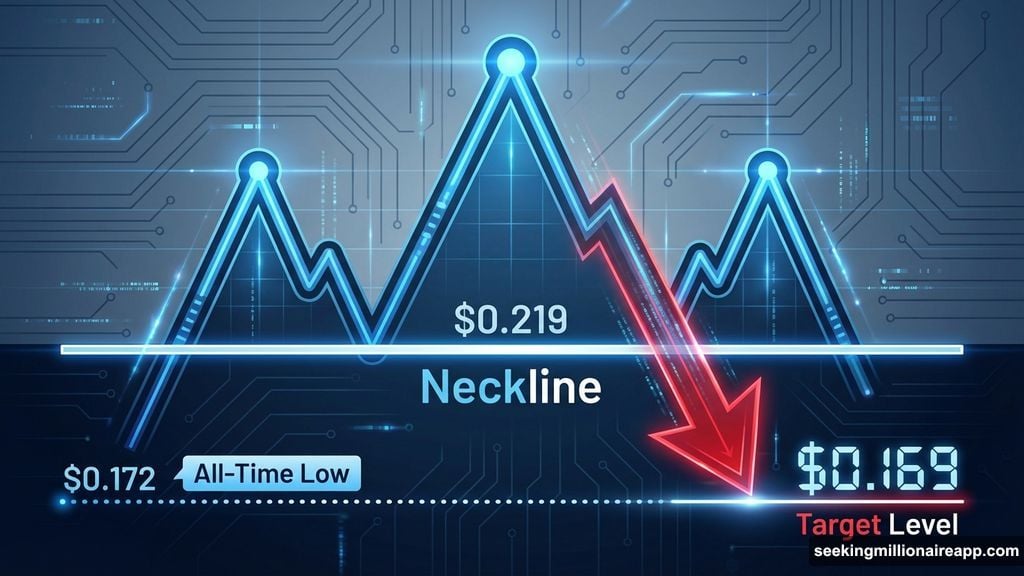
Pi Coin completed a textbook head and shoulders pattern when it fell below the $0.219 neckline. This formation signals bearish reversal after an uptrend.
Technical analysts measure downside targets by calculating the distance from the pattern’s head to its neckline. For Pi Coin, that distance suggests a 22.8% drop from the breakdown point. So the math points straight to $0.169.
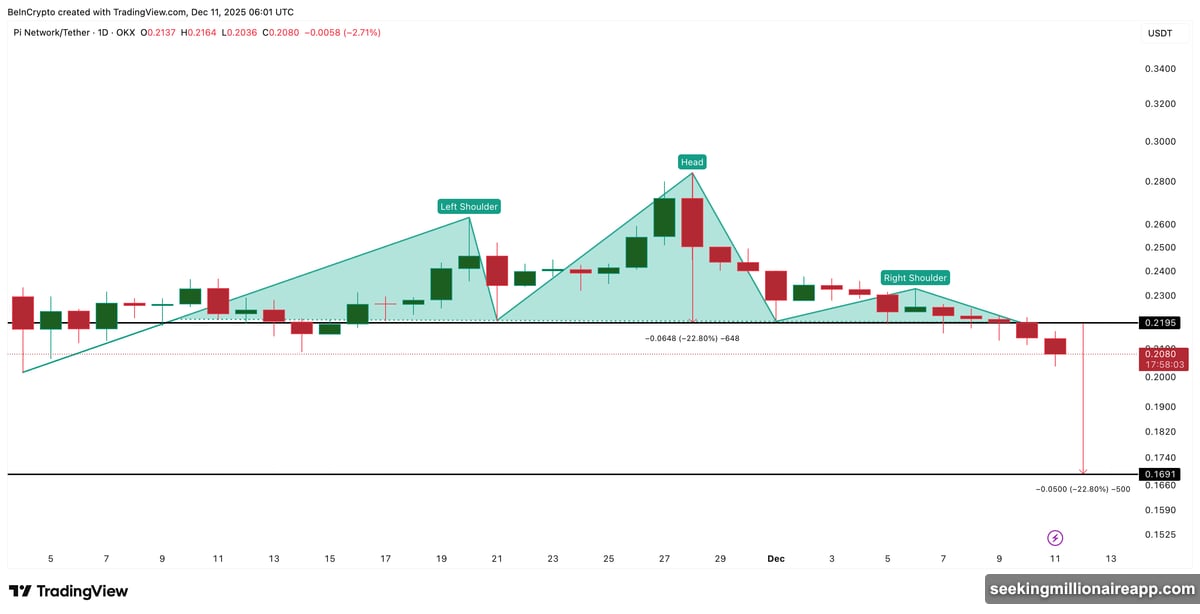
That matters because Pi’s current all-time low sits at $0.172 according to CoinGecko. A move to $0.169 would establish a fresh bottom. Yet despite this bearish setup, two metrics hint at possible stabilization.
Big Money Still Shows Up on Dips
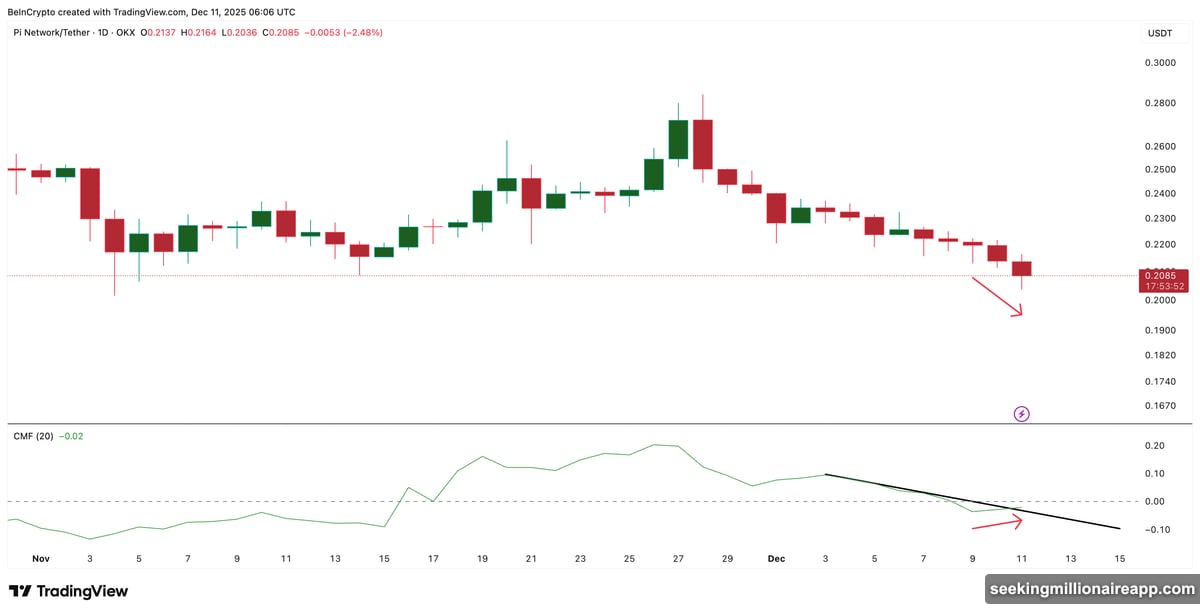
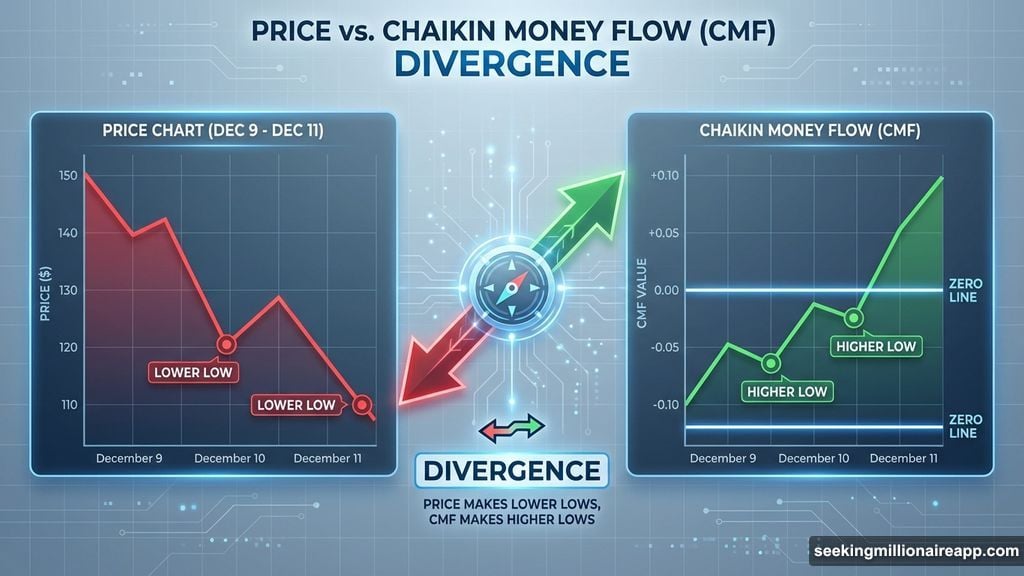
The Chaikin Money Flow (CMF) indicator tracks whether large traders are buying or selling. Between December 9 and December 11, something interesting happened.
Pi Coin’s price made a lower low during that period. But the CMF trended higher. This divergence typically means institutional buyers are accumulating during price drops.
Moreover, the CMF just broke above its short-term downtrend line. However, it hasn’t crossed above the zero line yet. That zero line marks the shift from net selling to net buying. Pi needs to clear that threshold to confirm real strength.
Still, the divergence shows sellers don’t have complete control. Buyers are stepping in at lower prices.
Momentum Hints Selling Pressure Is Fading
The Relative Strength Index (RSI) tells a similar story through a different lens. Between November 4 and December 10, the price formed a higher low. But the RSI made a lower low during the same timeframe.
Technical analysts call this hidden bullish divergence. It often appears before trend reversals because it shows selling pressure is weakening even as price dips.
This doesn’t immediately reverse the breakdown. But it suggests the downtrend might be losing steam. Sellers are still in charge, yet their grip is loosening.
Three Price Levels That Decide Everything
Pi Coin trades near $0.208 right now. The fate of this token depends on what happens at three critical zones.
First, watch $0.192. That’s the most important support level. A break below it confirms the pattern target of $0.169 and locks in a new all-time low.
Second, recovery requires reclaiming $0.233. This level sits above the pattern’s right shoulder. Moving back above it would show early signs of improvement and invalidate some bearish pressure.
Third, a full trend reversal only happens above $0.284. That’s the zone above the pattern’s head. Breaking through there would cancel the entire bearish formation.
Why This Breakdown Might Not Be Fatal
Most traders see completed head and shoulders patterns as extremely bearish. They’re often right. But this situation has unusual characteristics.
The money flow divergence shows institutional buyers are active despite the breakdown. The RSI divergence suggests selling pressure is already fading before the pattern reached its target.
These early support signals don’t guarantee a recovery. They just mean the path to $0.169 isn’t guaranteed either. Buyers are fighting back at every level.
So Pi Coin sits in a strange spot. The pattern says new lows are coming. The indicators say buyers are still defending key levels. The next few days will show which force wins.
What Happens Next Depends on $0.192
The immediate focus is simple. Either Pi holds $0.192 or it doesn’t.
If that support breaks, the pattern target of $0.169 becomes the next stop. That would create a new all-time low and potentially trigger another wave of selling as stop losses get hit.
If Pi defends $0.192, the divergences might have time to play out. A bounce from current levels could target $0.233 first, then potentially challenge higher resistance.
The breakdown looks bad on the surface. The underlying metrics tell a more nuanced story. Sellers are winning the battle right now. But buyers haven’t surrendered the war.