Pi Network is clinging to a critical price level right now. After a brutal 35.74% drop in just over a week, PI is trading near $0.20 and trying to claw back some ground. But the technical signals are flashing warning lights, not green ones.
So is this a real recovery, or just a brief pause before more pain? The data leans toward caution.
The Squeeze Momentum Reading Is Ugly
The Squeeze Momentum indicator tells you whether buying or selling pressure is building beneath the surface. Right now, it’s telling a very uncomfortable story for PI holders.
The current reading sits at -0.0241. That’s the most negative reading on the chart going all the way back to September 2025. The histogram bars have flipped deep red and keep pushing lower, not flattening out or reversing. That means bearish momentum is still accelerating.
Plus, the black dots sitting above the zero line on the squeeze band confirm the squeeze has already fired to the downside. For this signal to flip bullish, those red bars would need to shrink and eventually turn green. That hasn’t happened yet.
Until the Squeeze Momentum crosses back above zero, any daily bounce risks getting swallowed by the underlying selling pressure. A 4.43% daily pop sounds nice, but it means little against that backdrop.
Money Flow Index Signals Neutral, Not Oversold
The Money Flow Index (MFI) adds a more layered picture. Back around March 11 and 12, MFI spiked above 84, pushing deep into overbought territory. That extreme reading came right before the sell-off started, which in hindsight was a pretty clear warning sign.
Today the MFI sits at 42.34. That puts it squarely in neutral territory, between the oversold threshold of 20 and the overbought threshold of 80. On one hand, that means PI isn’t technically oversold yet. On the other, it means there’s no strong buy signal forming either.
The drop from 84 down to 42 in roughly ten days is steep. It reflects significant capital leaving the asset fast. For a genuine recovery to build momentum, you’d ideally want MFI to dip toward 20, where oversold conditions could attract fresh buyers looking for value. We’re not there yet.
The Fibonacci Levels That Actually Matter
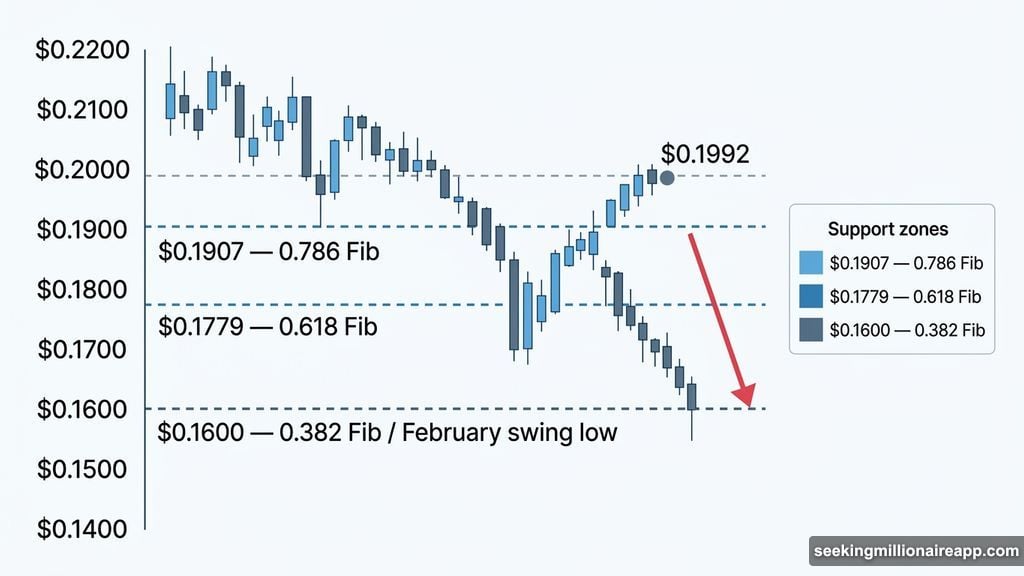
Looking at the daily price chart, PI is hovering just above the 0.786 Fibonacci retracement level at $0.1907. This is the most important price level to watch right now.
A daily close below $0.1907 opens the door to the next support at the 0.618 level, which sits around $0.1779. Below that, the 0.382 level near $0.1600 represents the maximum downside target within the current structure. That also happens to align with the February swing low, making it a significant floor if things deteriorate further.
On the upside, bulls need to push PI back above $0.2070 on a sustained basis to argue the correction is over. Beyond that, the two key resistance targets are $0.2250 and $0.2668. Clearing both would fully invalidate the bearish case.
What Happened Around the Kraken Listing
Timing matters here. Kraken listed PI on March 13, 2026, which coincided almost exactly with the local price peak near $0.2700. A new exchange listing typically brings a burst of buying enthusiasm. But it also brings newly liquid token holders who may have been waiting for exactly this moment to sell.
That dynamic appears to have played out. The Protocol 20 upgrade that followed provided limited support, as broader market pressure weighed on crypto assets generally. If token holders who gained liquidity through the Kraken listing continue selling, that $0.1907 support level faces real stress.
The clearest signal that PI’s recovery has actual staying power would be a confirmed daily close above $0.2070, ideally accompanied by an improving MFI reading trending back toward 60 or higher. Right now, neither condition is met.
Watching the $0.1907 Line
PI is at a genuinely uncertain crossroads. The Squeeze Momentum indicator shows the worst bearish pressure in months. The MFI hasn’t reached levels that would attract strong buying interest. And the Fibonacci structure puts $0.1907 as the last meaningful support before a deeper pullback becomes the base case.
That said, neutral MFI also means the selling isn’t as frenzied as it was at the start of the decline. Some of the panic appears to have subsided. If PI can hold $0.1907 and gradually improve its momentum readings, a slower, steadier recovery remains possible.
But that recovery needs actual confirmation, not just hope. Watch the close, watch the MFI, and watch whether those red histogram bars start shrinking. Until they do, the burden of proof sits firmly on the bulls.