XRP dropped over 18% since November 10. Now it’s testing support near $2.15, and the data suggests this decline isn’t finished yet.
Long-term holders are selling faster. Buying volume keeps shrinking. And the price remains trapped inside a pattern that typically signals more downside ahead. So the question isn’t whether XRP will bounce. It’s whether the current floor holds or breaks.
Let’s examine what the charts and on-chain data reveal about where XRP goes next.
Price Stuck Inside Bearish Channel For Over a Month
XRP has moved inside a descending channel since early October. This pattern works like a downward-sloping tunnel. Every rally attempt hits the upper boundary and gets rejected. Every decline finds temporary support near the lower edge.
That’s a bearish continuation structure. It tells you the trend remains down until proven otherwise.
Recent price action confirms this view. Between November 4 and 9, XRP tried to break higher. The token climbed briefly above the channel midpoint. But sellers pushed back, and the rally failed.
Since November 10, XRP fell 18.6% to its current level near $2.15. That puts the price dangerously close to $2.10, which has acted as the most important support zone inside this channel.
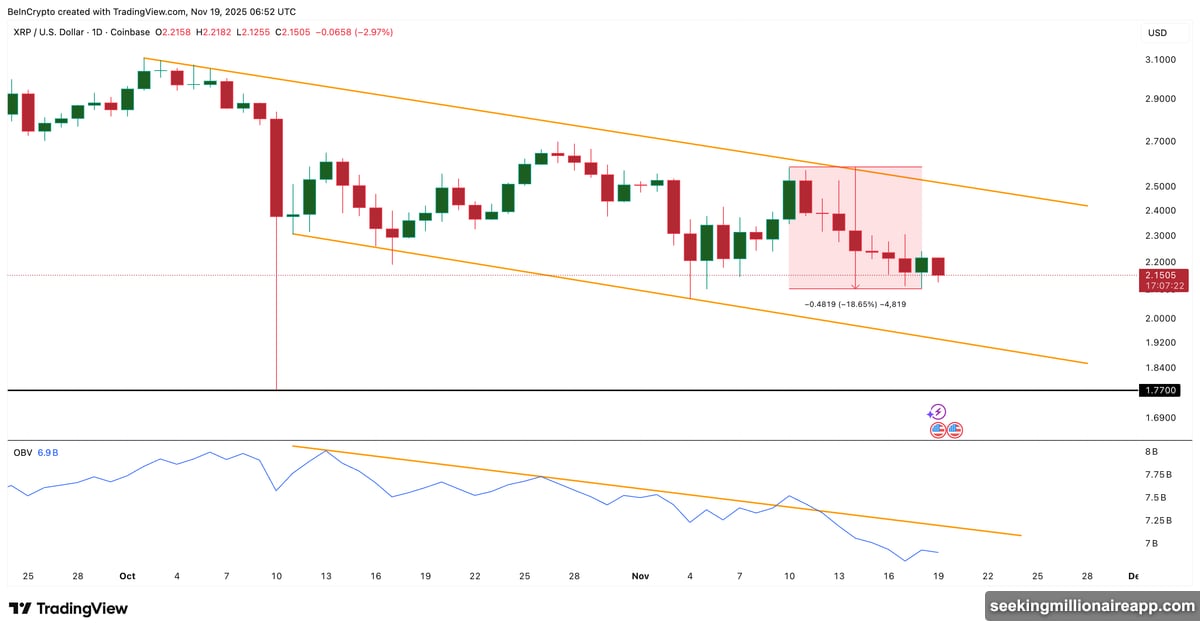
Here’s why that matters. If XRP closes below $2.10 on the daily chart, the next logical target drops to $1.77. That’s where the long-term channel floor sits right now.
On the flip side, bulls need to reclaim $2.41 to show any real strength. Clearing that level would open a path toward $2.58. Only a daily close above $2.58 would flip the short-term trend from bearish back to bullish.
Right now, XRP sits between those two critical zones. And the volume data suggests buyers aren’t ready to defend $2.10 with conviction.
Volume Weakness Confirms Buyers Are Losing Conviction
On-Balance Volume (OBV) tracks whether buying or selling pressure dominates the market. It adds volume on days when price closes higher. It subtracts volume on days when price closes lower.
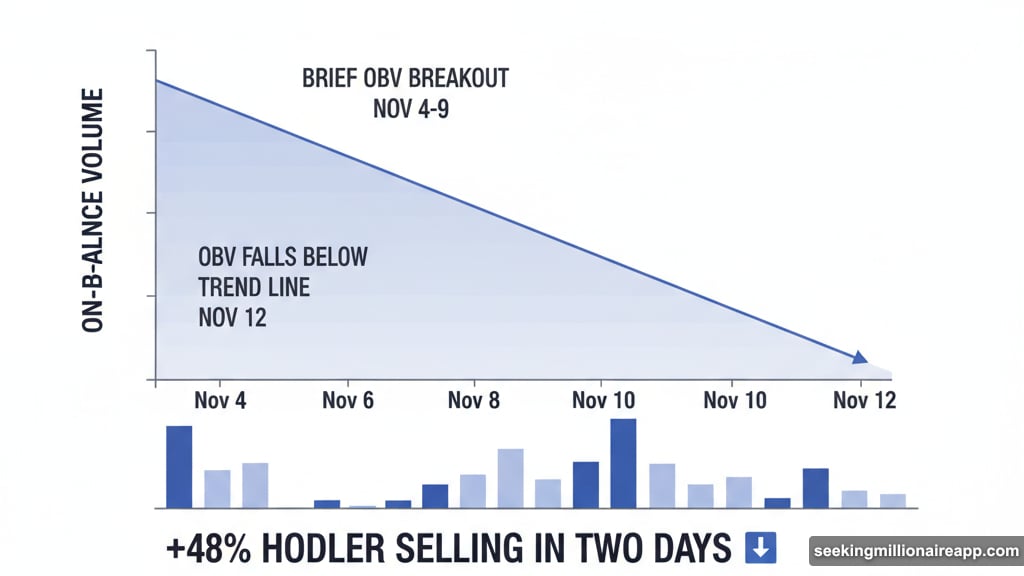
Between November 4 and 9, OBV briefly moved above its descending trend line. That short-term breakout matched the price bounce during the same period. But OBV slipped back below the trend line on November 12.
Since then, it’s stayed below that line. Meanwhile, XRP started its 18.6% decline on November 10, right when OBV began curling downward again.
This alignment isn’t a coincidence. When OBV falls while price drops, it confirms that selling pressure is building faster than buying interest. In other words, sellers are in control, and buyers aren’t stepping in to absorb the supply.
That creates a dangerous setup. Without strong volume support, even minor selling waves can push price lower. And when you combine weak volume with rising long-term holder outflows, the picture gets worse.
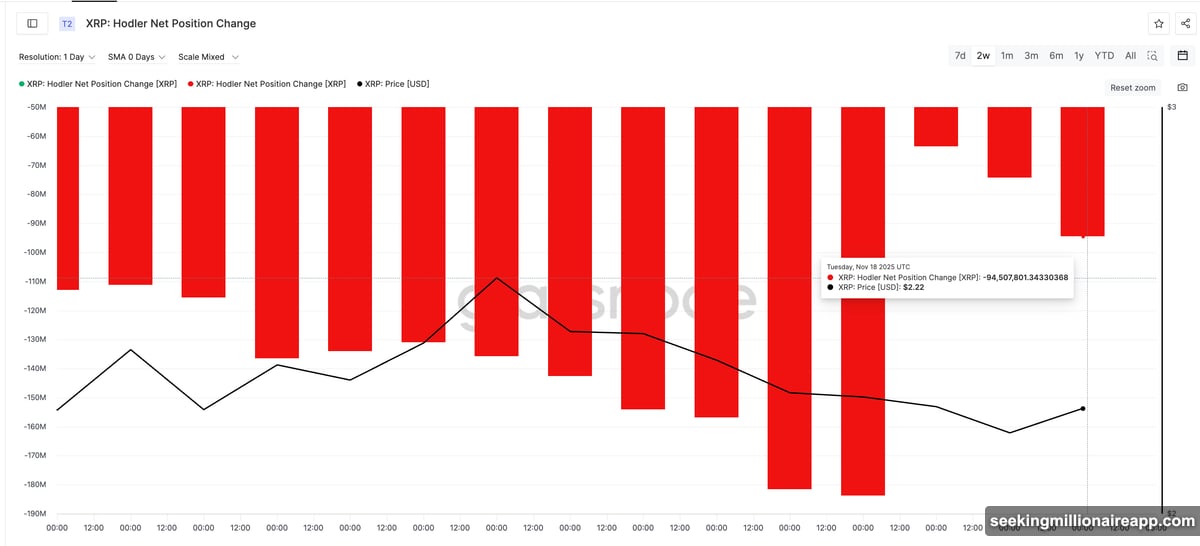
Long-Term Holders Increased Selling by 48% in Two Days
Glassnode tracks Hodler Net Position Change, which measures how much supply long-term holders are moving. Negative numbers mean holders are sending tokens to exchanges or reducing positions. Positive numbers mean they’re accumulating.
On November 16, long-term holder outflows hit the lowest fortnightly level at –63.57 million XRP. That suggested selling pressure had temporarily cooled.
But just two days later, on November 18, outflows jumped to –94.50 million XRP. That’s a 48.6% increase in long-term selling within 48 hours.
This spike confirms what OBV already showed: sellers are becoming more aggressive, and buyers aren’t stepping up to match that pressure.
Long-term holders typically have stronger conviction than short-term traders. When they start selling faster, it signals a shift in sentiment. And when their selling increases while buying volume weakens, it usually means the market hasn’t found a bottom yet.
So the question becomes: can buyers defend $2.10, or does XRP slide deeper into its channel?
The Next Move Depends on One Support Level

XRP now sits just above $2.10, the most critical support inside the falling channel. This level has held multiple times over the past month. Each time price approached $2.10, buyers stepped in and pushed it back up.
But each of those bounces got weaker. And this time, the setup looks more fragile than before.
If XRP closes below $2.10 on the daily chart, the path opens toward $1.77. That’s where the long-term channel floor sits. And if volume stays weak while long-term holders keep selling, $1.77 becomes the likely next stop.
On the other hand, bulls need to reclaim $2.41 to invalidate this bearish setup. Clearing that level would show that buyers have regained strength. It would also open the door toward $2.58, where short-term momentum could flip back to bullish.
But as long as XRP stays below $2.41, the structure remains bearish. Volume continues to weaken. Long-term holders are selling faster. And the price sits inside a falling channel that has guided every move for over a month.
Why This Setup Favors More Downside
Three factors stack against XRP right now.
First, the descending channel has framed every move since early October. Channels like this typically resolve downward unless buying pressure surges enough to break the upper boundary. So far, that hasn’t happened.
Second, OBV stayed below its trend line for over a week. That confirms selling pressure is dominating the market. Without strong volume support, even modest selling waves can push price lower.
Third, long-term holders increased their selling by 48% in just two days. When holders with strong conviction start reducing positions faster, it usually signals a shift in sentiment. And when that happens while volume weakens, it creates a setup where supply outpaces demand.
Together, these three factors point toward the same conclusion: XRP hasn’t found its bottom yet.
That doesn’t mean XRP can’t bounce from $2.10. Short-term rallies happen inside falling channels all the time. But those bounces typically fail near the channel midpoint or upper boundary. And until XRP closes above $2.41, those rallies are just temporary relief inside a broader downtrend.
What Traders Should Watch Next
XRP needs to prove it can hold $2.10. If the daily candle closes below that level, the next target drops to $1.77. That’s where the long-term channel floor sits right now.
If buyers defend $2.10 and push XRP back above $2.41, the short-term outlook improves. Reclaiming $2.41 would signal that buyers have regained control. And a close above $2.58 would flip the trend from bearish to bullish.
But as long as XRP trades between $2.10 and $2.41, the structure favors more downside. Volume remains weak. Long-term holders are selling faster. And the falling channel continues to cap every rally attempt.
So the fragile floor at $2.10 decides whether XRP stabilizes or enters a deeper slide. All eyes stay on that level until the market shows a clear shift in momentum.