Solana just shed 5.3% in 24 hours. That extends monthly losses past 27%. Plus, it’s among the worst performers in large-cap altcoins this week.
But here’s the twist. While the charts look brutal, several signals suggest the bleeding might stop soon. The worst damage may already be done.
Two technical crossovers are forming on Solana’s daily chart. Both point to more downside pressure. Yet derivatives data and holder behavior tell a different story. Long-term investors aren’t panicking. In fact, they’re barely selling at all.
So what happens next? The answer depends entirely on whether $155 holds.
Double Bearish Crossovers Signal More Pain
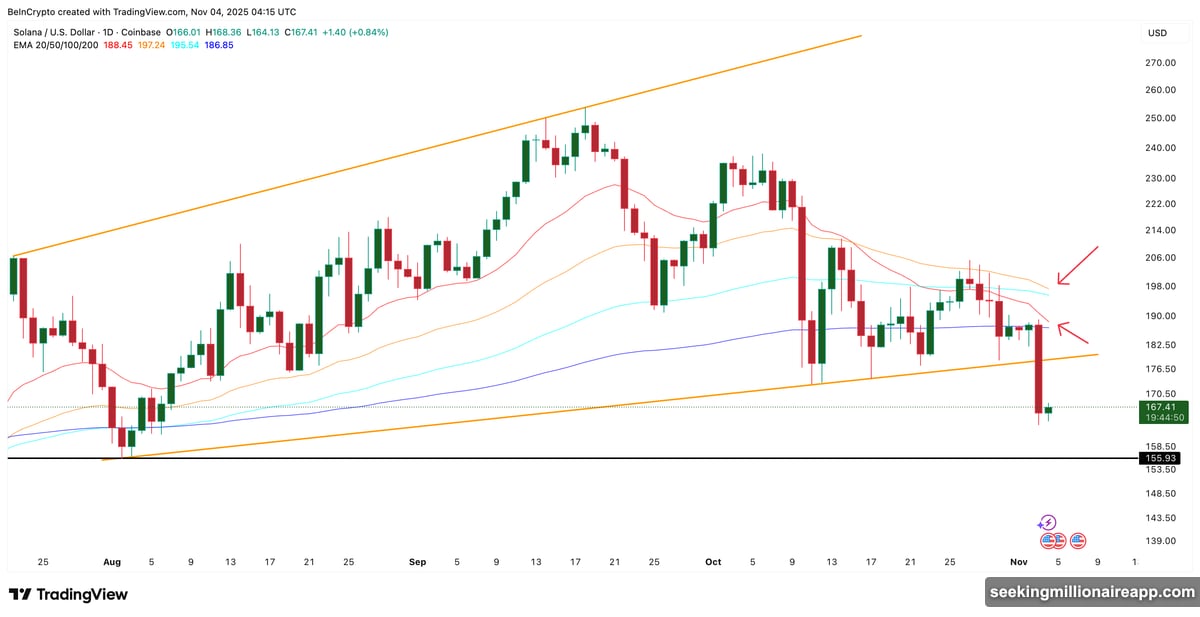
Solana broke down from a rising wedge pattern weeks ago. That confirmed the bearish shift. Now two more technical warnings are flashing.
The 50-day exponential moving average is about to cross under the 100-day. Meanwhile, the 20-day approaches a similar cross below the 200-day EMA. These crossovers typically precede extended declines before a bottom forms.
Exponential moving averages weight recent price action more heavily than older data. When short-term EMAs cross below longer-term ones, it signals sellers have seized control. Two crossovers happening simultaneously amplify that message.
However, crossovers are lagging indicators. They confirm what already happened rather than predict what comes next. So while they validate the current downtrend, they don’t guarantee further collapse.
The key question isn’t whether Solana looks weak on charts. It does. The real question is whether selling pressure has room to intensify or if most damage is behind us.
Long Squeeze Drove the Latest Drop
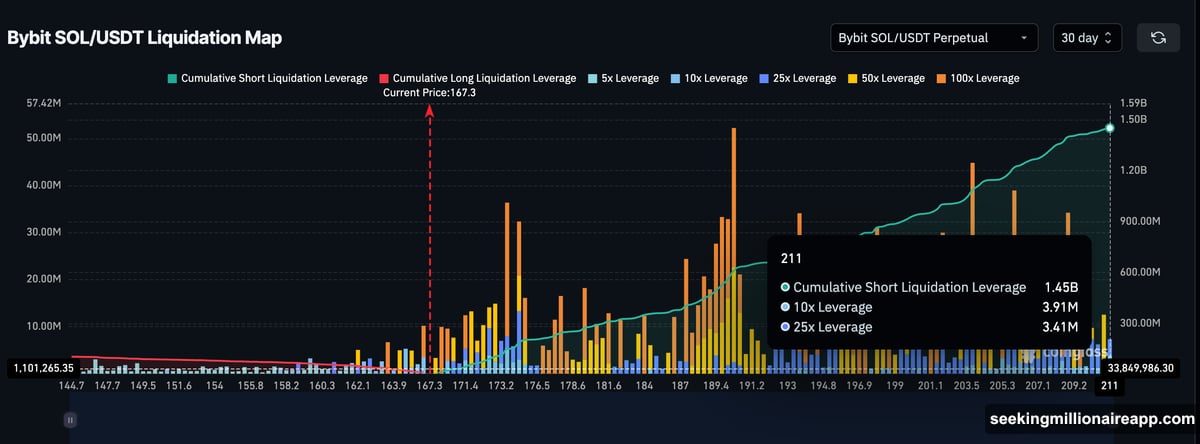
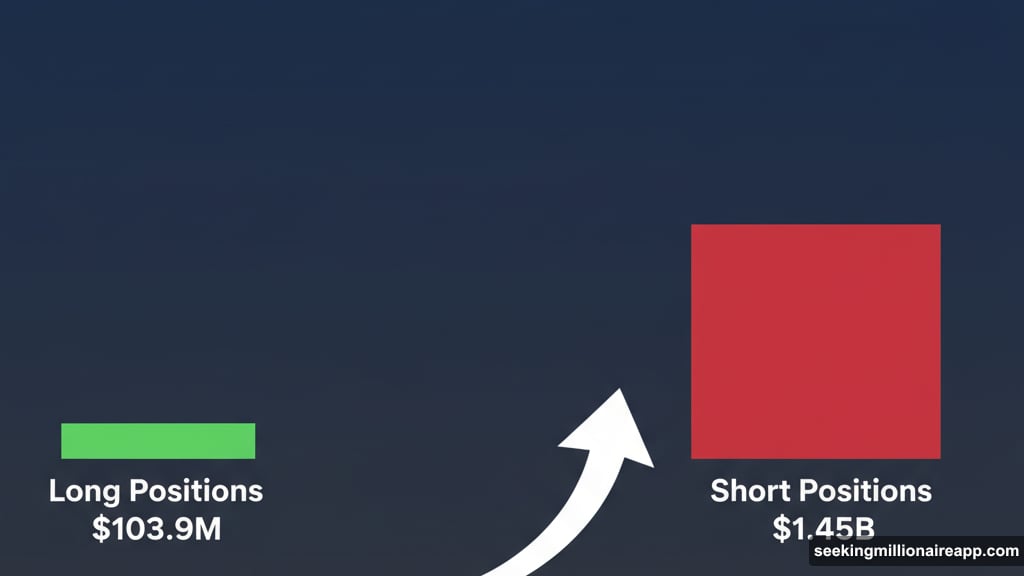
Solana’s 5.3% daily plunge wasn’t driven by spot selling. Instead, derivatives positions got wrecked. Bybit data reveals the magnitude of the long squeeze.
Only $103.9 million in long leverage remains on that exchange. Compare that to $1.45 billion in short positions. The massive imbalance confirms longs got liquidated aggressively over the past month.
Most leveraged bulls already exited their positions. That means fewer forced sellers remain in the system. Plus, with shorts now dominant, even modest price rebounds could trigger a short squeeze.
Short squeezes occur when rising prices force bearish traders to buy back positions. That buying pressure can accelerate rallies quickly. Given how lopsided positioning has become, Solana faces asymmetric potential for snapback moves.
Of course, that doesn’t guarantee a rally. But it does suggest the path of least resistance may be shifting.
Holders Aren’t Actually Selling
On-chain data confirms that long-term Solana holders aren’t dumping. The Holder Net Position Change metric tracks how much SOL moves into or out of long-term wallets.
On October 7, net outflows hit 10.52 million SOL. By November 3, that figure dropped to just 1.37 million SOL. That represents an 87% reduction in selling pressure from holders.
This pattern separates short-term speculators from long-term believers. Traders panic. Holders sit tight. The decline in net outflows suggests conviction remains among those who accumulated Solana at various price points.
Meanwhile, derivatives traders flush out with leverage. Those forced liquidations create sharp drops without corresponding spot selling from wallets. That disconnect explains why prices fell hard while holder behavior stayed relatively calm.
Strong hands aren’t budging. Weak hands already left. That combination often precedes stabilization.
Everything Hinges on $155 Support
Solana currently trades around $166. The immediate support zone sits at $163. If that level fails, the next critical floor appears near $155.
That $155 level matters enormously. It represents the point where most remaining long positions face liquidation. Breaking below it would likely trigger a cascade to new lows. That scenario would invalidate the “limited downside” thesis entirely.
However, holding $155 could spark a rebound. The first resistance waits at $180, followed by $191. Both levels coincide with major short liquidation clusters. Pushing through $191 might ignite a short squeeze toward $200.
An even stronger breakout could reach $222, which aligns with the 0.786 Fibonacci retracement level. But that outcome requires $155 to hold first and foremost.
For now, the path of least resistance still points down. Bearish crossovers confirm the prevailing trend. Yet with longs mostly liquidated and shorts piled up, Solana’s next bounce might arrive sooner than expected.
Why This Drop Feels Different
Most corrections feature persistent selling from holders alongside derivatives flushing. This one doesn’t. The 87% drop in holder net outflows reveals that conviction holders aren’t capitulating despite brutal price action.
Plus, derivatives positioning flipped dramatically. Longs dominated earlier. Shorts dominate now. That shift creates potential energy for reversal moves.
The combination of holder stability and lopsided positioning suggests Solana might be building a base rather than free-falling into oblivion. Bases form when weak hands exit and strong hands accumulate. The data suggests that transition is underway.
Of course, bases take time. Solana won’t reverse instantly. But the ingredients for stabilization are assembling. The question is whether buyers step in before sellers test lower levels.
What Traders Should Watch
The $155 support level deserves obsessive attention. Breaking below it changes everything. Holding it validates the stabilization thesis.
Also monitor short leverage on exchanges. If shorts continue building while price holds, squeeze risk intensifies. Conversely, if shorts start closing proactively, it signals bears losing confidence in further downside.
Finally, track holder outflows weekly. If the 87% reduction reverses and outflows spike again, it indicates even patient investors are losing faith. That would be genuinely bearish.
For now, Solana sits at a crossroads. The charts scream weakness. The data whispers resilience. Which signal proves accurate determines whether we’ve seen the worst or just a preview.