Solana is limping into April 2026 with a lot of baggage. Six straight months of red closes, a freshly confirmed chart breakdown, and shrinking buying pressure on exchanges. None of that screams “turnaround incoming.”
But markets rarely move in straight lines. So let’s walk through what the data actually shows, where SOL could find support, and what levels matter most this month.
Six Consecutive Red Months Break Seasonal Patterns
Solana hasn’t closed a single month in the green since September 2025. That’s a rough stretch by any measure.
January 2026 dropped 15.3%. February fell another 20%. March is closing with a modest loss near -0.88%, but a loss is still a loss. What makes this streak particularly notable is that it flies in the face of historical norms. March, for instance, carries a historical median return of +11.1% for SOL. This year delivered the opposite.
April doesn’t offer much seasonal comfort either. The historical median return for SOL in April sits at -0.82%, making it one of the weakest months on the calendar. Given that 2026 has already broken multiple seasonal patterns to the downside, leaning on historical averages feels especially risky right now.
Head-and-Shoulders Breakdown Targets $73
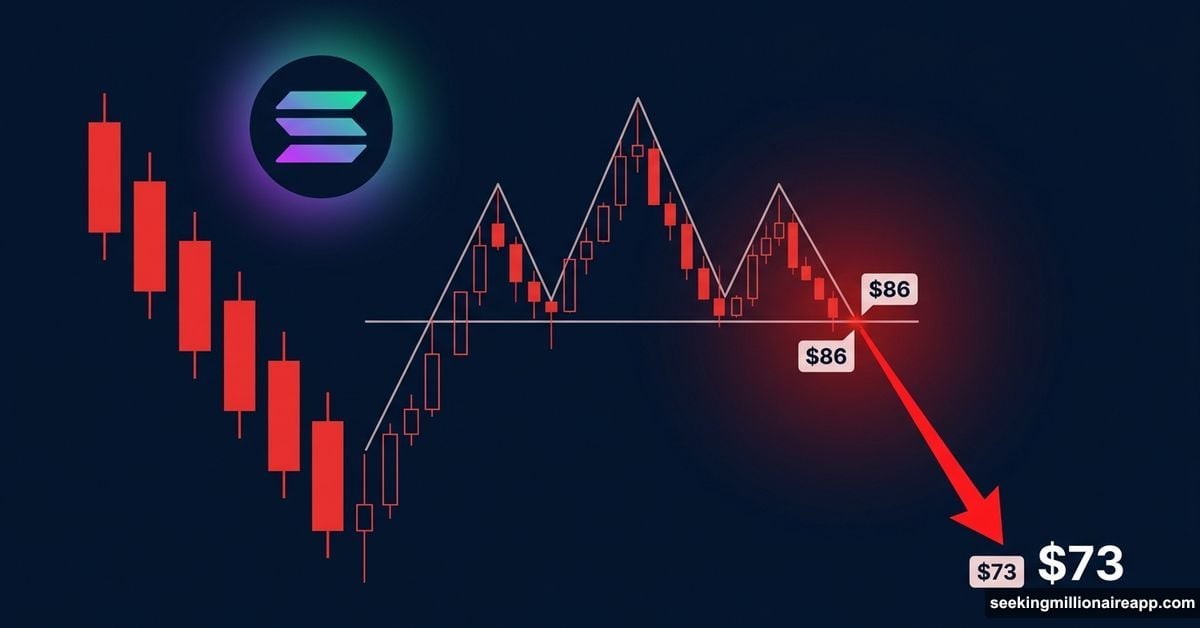
The daily chart is telling a bearish story. A head-and-shoulders pattern completed its breakdown on March 27, projecting a measured move target near $73. That would represent an additional 15% decline from the breakdown point.
The 20-day Exponential Moving Average (EMA) currently sits at $86 and serves as the most important near-term recovery line. The EMA gives greater weight to recent price movements, making it a reliable trend indicator. The last time SOL reclaimed this level was in early March, and it sparked a 13% rally that actually formed the “head” of the pattern.
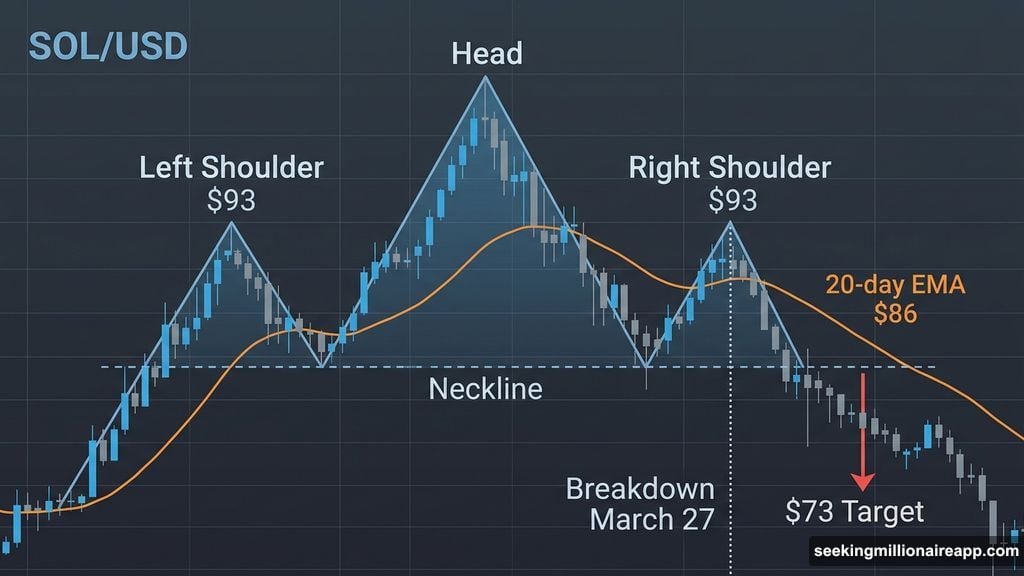
So heading into April, the $86 EMA acts as a dividing line. Trade below it and the bearish structure stays intact. Reclaim it cleanly, and SOL has a shot at challenging $93, the right shoulder high that would weaken the entire breakdown thesis.
Exchange Buying Pressure Collapsed 80% in One Week
On-chain data from Glassnode paints a concerning picture for spot demand heading into April.
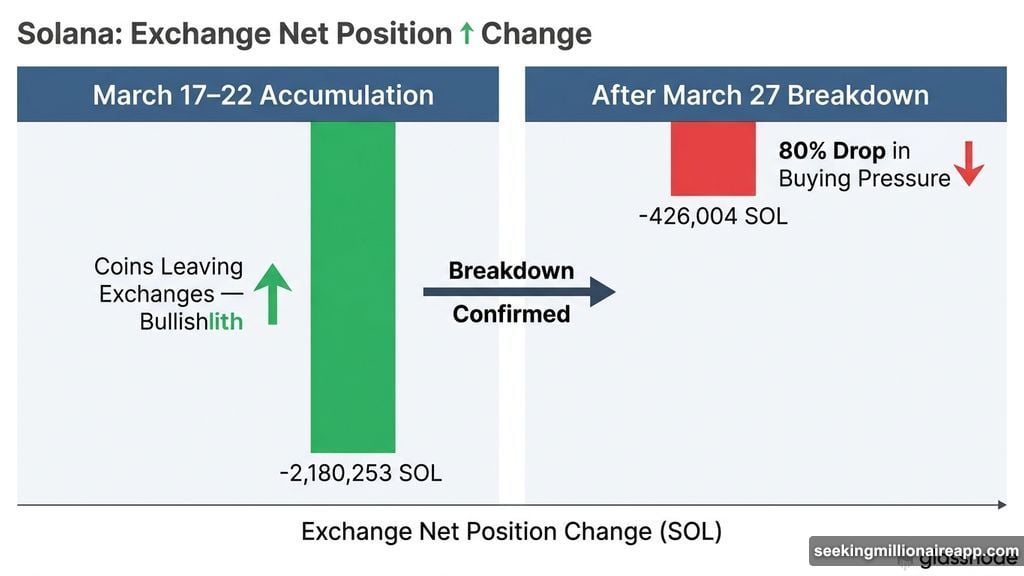
Exchange net position change measures tokens flowing in and out of exchanges. From March 17 through March 22, this metric showed strong accumulation, peaking at approximately -2,180,253 SOL leaving exchanges. Coins leaving exchanges typically signal active buying and accumulation. That’s bullish behavior.
But since the breakdown confirmed on March 27, that number collapsed to roughly -426,004 SOL. That’s an 80% drop in buying pressure within a single week. The timing matters. The chart broke down and buyers essentially walked away at the same time.
The short-term holder Net Unrealized Profit/Loss (NUPL) adds another layer of concern. NUPL measures whether short-term holders are sitting on profits or losses in aggregate. It climbed from deep capitulation at -0.95 on February 5 to around -0.27 on March 25 before settling near -0.40.
In plain terms: short-term holders are still underwater, but far less so than they were weeks ago. That’s actually a problem. If spot demand doesn’t return in April, these holders may decide to cut their remaining losses and sell rather than ride a potential move toward $73. Fresh selling from this group could accelerate the decline.
Long-Term Holders Are Buying. But That’s Not Always a Good Sign.
One metric is pushing back against the bearish narrative. Long-term holder accumulation surged from 523,624 SOL on March 8 to 2,327,302 SOL by March 29. That’s more than a fourfold increase in roughly three weeks. These are mid- to long-term participants adding aggressively, and that kind of conviction can provide psychological support.
However, history here offers a cautionary note. The last time hodlers began accumulating this heavily, between January 10 and January 31, SOL’s price actually fell from $135 to around $105 during that same period. Their buying didn’t prevent the decline at all.
So while hodler accumulation is genuinely encouraging, it hasn’t historically aligned with immediate price recoveries. Without confirmation from exchange demand returning, their buying alone may not be enough to stop the measured move from playing out.
The Key Price Levels Heading Into April
There are a few specific numbers that matter most this month.
$80 is the most critical near-term floor. A daily candle close below that level would make the $73 target far more realistic and open the door to a full 15% decline. The $73 zone also aligns with the 1.618 Fibonacci retracement level, which adds technical confluence to that target area.
On the upside, $85 is the first meaningful resistance, representing the 0.618 Fibonacci level. Above that, the 20-day EMA at $86 becomes the key line to watch. A sustained reclaim above $86 could spark short-term momentum and push SOL toward the $93 right shoulder high. Hold above $93 and the entire bearish structure starts to crack.
For now, April is about survival. The confirmed breakdown, collapsing exchange demand, and fragile short-term holder positioning all point toward more downside risk than upside potential. The difference between a relief rally to $93 and a continuation toward $73 comes down to whether buyers step back in early or stay on the sidelines.
Watch $86. That’s the line that separates the two outcomes.