Markets are nervous right now. And honestly, they have good reason to be.
US stocks dropped on April 7 as three powerful forces collided at once: a fresh geopolitical shock, oil prices hitting multi-year highs, and a Federal Reserve that looks increasingly stuck. The result? A broad selloff that hit almost every corner of the market.
Here’s what pushed stocks lower today and what investors are watching most closely heading into the weekend.
Trump’s “Civilization” Warning Kills the Peace Trade
Earlier this week, markets had been quietly hopeful. Diplomatic back-channels between the US and Iran suggested partial de-escalation was possible. That optimism evaporated fast.
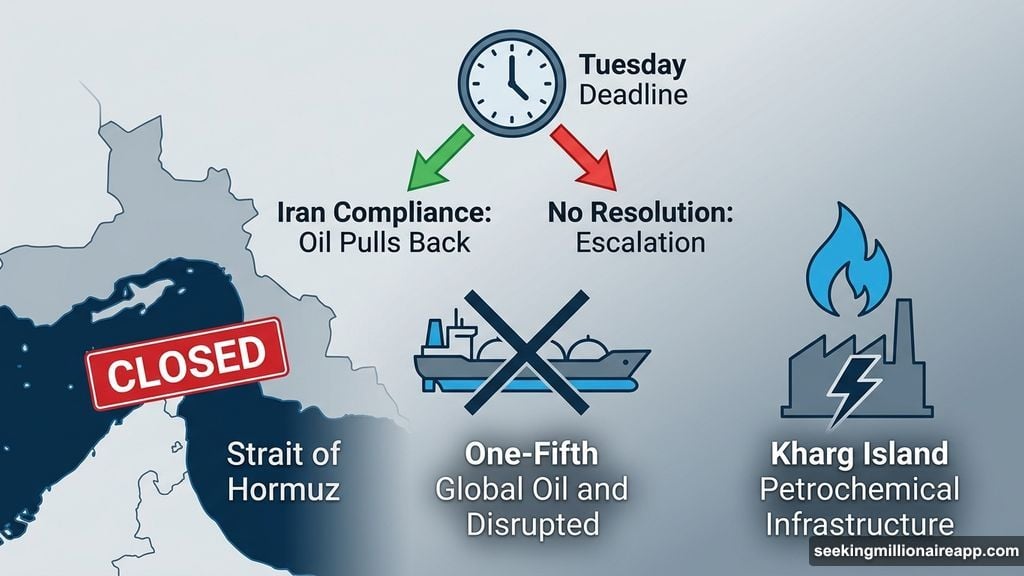
Trump’s warning that “a whole civilization will die tonight,” made ahead of his self-imposed Tuesday deadline for Iran to reopen the Strait of Hormuz, torched whatever remained of the de-escalation narrative. Reports of Israeli strikes on Iran’s Kharg Island petrochemical infrastructure piled on. Any trader still holding a “conflict winds down soon” position started heading for the exit.
The Strait of Hormuz closure has already disrupted roughly one-fifth of global oil and LNG supplies. That’s not a rounding error. It’s a structural shock to energy markets that directly feeds into everything else.
Iran’s counter-proposal to Trump’s 15-point peace plan is expected today, making the weekend a genuine potential turning point. If Tehran signals compliance or offers a negotiated pathway, oil could pull back sharply and give equities some breathing room by Wednesday. If the deadline passes without resolution, the calculus gets much uglier.
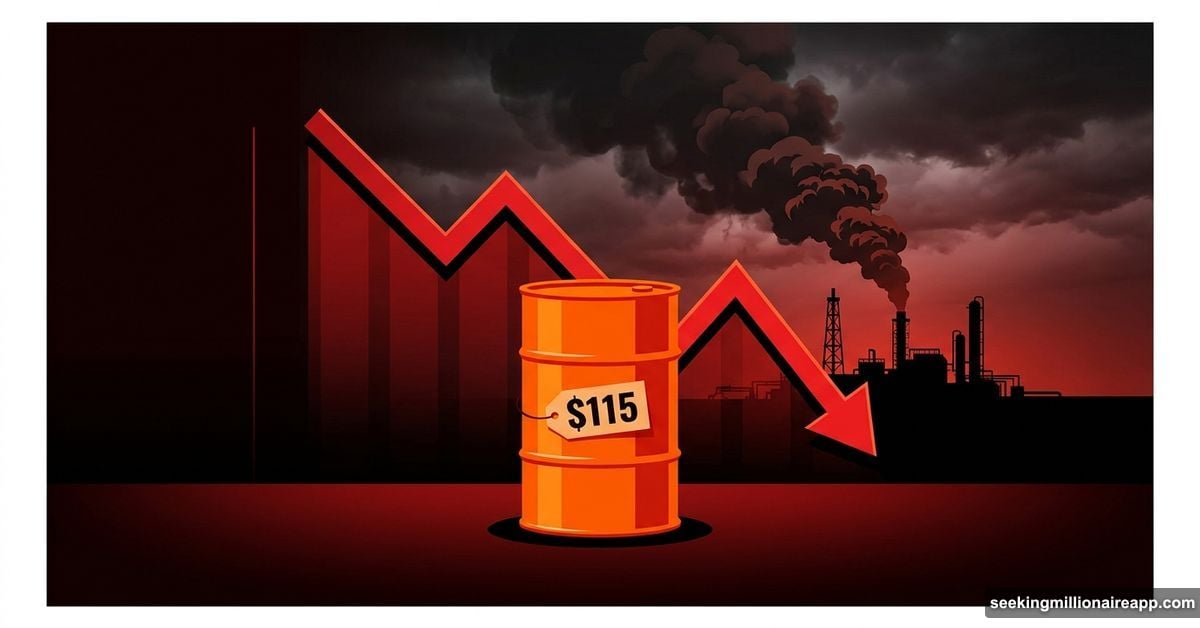
WTI Crude at $115 Tightens the Oil-Inflation-Rates Chain
West Texas Intermediate crude surged to $115.19 on April 7, up 13% in a single week. That’s the kind of move that changes the entire macroeconomic picture.
Oil at these levels works like a tax. It raises fuel costs, lifts transportation and input costs across every sector, and squeezes consumer spending power. For the Federal Reserve, it’s a nightmare scenario. The central bank can’t cut rates while oil-driven inflation is accelerating.
CME FedWatch data showed no rate cuts expected until December 2027, with a 51% chance of a rate hike by March 2027. The 10-year Treasury yield climbed to 4.48%, reflecting markets repricing the “higher for longer” interest rate environment. The March Consumer Price Index report arrives Friday and is expected to show the sharpest monthly increase since 2022. A hot print would make rate relief look even more distant.
Apple’s 3.35% Drop Drags the S&P 500 Lower
Apple (AAPL) fell 3.35% after Nikkei Asia reported engineering setbacks in the foldable iPhone program that could push back production timelines. Because Apple carries the largest weighting in the S&P 500, a nearly 4% decline mechanically drags the entire index lower regardless of what else is happening in the market.
It’s one of those days where the headline number understates the underlying selling pressure. The index held up better than individual stocks suggest partly because energy names provided a partial offset.
Where the Major Indexes Landed
All four major indexes finished in the red as of press time:
- S&P 500 fell 28.89 points, or 0.44%, to 6,582.94. The index dipped over 1% earlier in the session before recovering.
- Dow Jones Industrial Average dropped 244.33 points, or 0.52%, to 46,425.60.
- Nasdaq Composite declined 141.40 points, or 0.64%, to 21,854.90, confirming the index entered correction territory.
- Russell 2000 slipped 0.85 points, or 0.34%, to 251.51.
Market breadth tells the real story. About 3,365 stocks declined (60.4%) versus just 1,990 advancing (35.7%). That’s a broad selloff, not a targeted rotation.
S&P 500 Technical Picture: Waiting for a Catalyst
Technically, the S&P 500 is sitting in an uncomfortable spot. The index is grappling with two converging Exponential Moving Averages (EMAs), which are trend indicators that give more weight to recent price action. The 20-day EMA sits at 6,601 and the 200-day EMA at 6,587. When these two levels compress this tightly, it usually means the market has lost directional conviction and is waiting for something to force a resolution.
The intraday low of 6,534 found support near the 6,518 technical level. A daily close below 6,518 opens the path toward 6,441 and potentially the previous swing low at 6,316. On the upside, the S&P 500 needs a daily close above 6,643 to signal recovery strength, with 6,845 as the next meaningful target.
Energy and Defensives Hold Up. Everything Else Struggles.
Not every sector fell today, but the winners were few.
Energy led with a 0.54% gain as WTI stayed above $115. Higher oil prices directly increase producer revenue, so energy stocks have a clear structural tailwind from the Iran conflict. Utilities added 0.35% as nervous investors parked capital in yield-paying defensives. Communication Services gained 0.30%, supported by Google (GOOG) rising 1.21%.
The losses were broader and more painful. Consumer Cyclical led declines at 1.48%, which makes sense when you think about it. Higher oil prices drain discretionary spending power by raising fuel and transportation costs everywhere. Tesla (TSLA) fell 2.94%, Home Depot (HD) dropped 2.60%, and Walmart (WMT) lost 2.66%.
Consumer Defensive fell 1.30%, which is the unusual part. Traditionally safe sectors don’t fall this hard unless selling pressure is broad enough to hit everything. Coca-Cola (KO) lost 1.34% and Procter & Gamble (PG) dropped 0.67%. Even conservative holdings weren’t safe today.
Basic Materials declined 0.63% despite gold holding above $4,400, showing that commodity-linked stocks aren’t fully insulated from macro selling pressure.
Two Stocks That Bucked the Trend
Two names stood out sharply against the selloff.
Broadcom (AVGO) jumped 4.92% after Anthropic signed an agreement with Google and Broadcom for multiple gigawatts of next-generation TPU capacity starting in 2027. The deal signals that AI infrastructure demand remains strong enough to override macro headwinds for companies directly tied to capacity buildout.
UnitedHealth Group (UNH) surged 10.08% on Medicare Advantage windfall news, making it the standout gainer in the S&P 500 for the day. The move provided a floor for the Healthcare sector that would have otherwise fallen further.
What Comes Next: Iran Deadline and Friday CPI
This is genuinely one of the most event-dense weeks the US stock market has faced in years. Two catalysts arrive in quick succession, and both could move markets significantly in either direction.
First, Trump’s Iran deadline arrives within hours. A diplomatic signal from Tehran could send oil retreating and lift equities sharply by Wednesday’s open. But if the deadline passes without resolution and strikes on Iranian energy infrastructure escalate, WTI could push even higher. That scenario would further tighten the oil-inflation-rates chain, push the 10-year yield toward new highs, and bring the S&P 500’s 6,316 swing low firmly into play.
Second, Friday’s March CPI report arrives. A hot number reinforces the “higher for longer” rate narrative and keeps pressure on growth stocks. A softer reading could give the Nasdaq and consumer sectors some relief.
The honest truth is that both catalysts are genuinely uncertain right now. Markets hate uncertainty more than bad news. So until either the Iran situation clarifies or Friday’s inflation data lands, expect continued volatility and tight trading ranges. The EMA compression on the S&P 500 chart is telling you exactly that: the market is coiled, waiting to break in one direction or the other.