Something unusual is happening on Wall Street right now. Bearish signals are flashing across multiple markets at the same time, and the scale of the pessimism is reaching levels most investors haven’t seen in years.
This isn’t just one indicator acting strange. It’s several, all pointing in the same direction simultaneously. And when that happens, it’s worth paying close attention.
![A dark red stock market ticker board showing sharp declines, with Wall Street financial district visible in the background, illustrating extreme bearish sentiment in 2026]
Fear and Greed Index Drops to Near-Zero
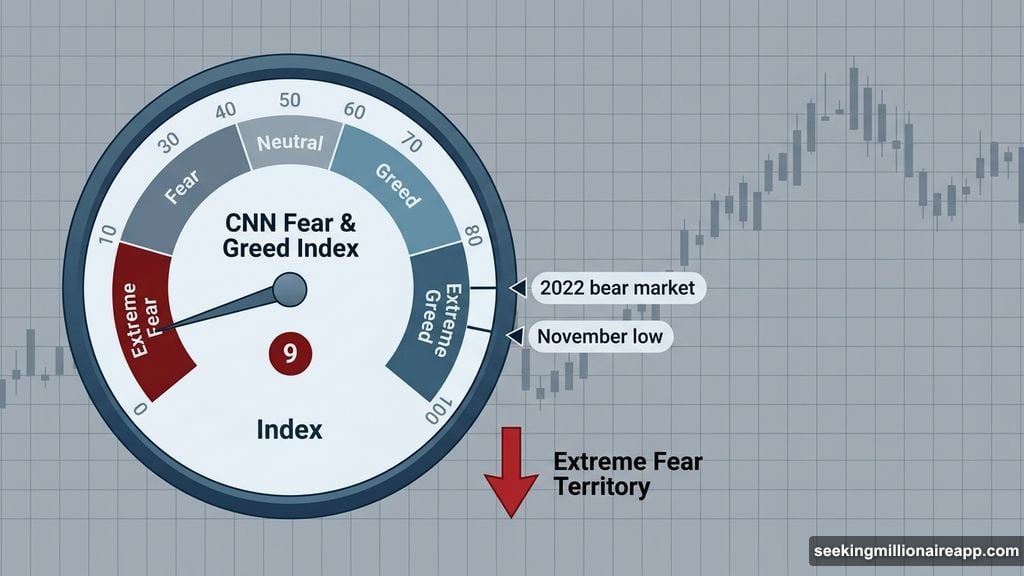
The CNN Stock Market Fear and Greed Index just hit a reading of 9. That’s not a typo.
The index runs from 0 to 100. Zero means pure, total panic. One hundred means euphoric optimism. A reading of 9 puts us firmly in “extreme fear” territory — the lowest this index has registered since November.
So what does that actually mean? Essentially, investors are scared. Not mildly cautious. Genuinely alarmed. And that fear is showing up in how they’re betting their money.
Russell 3000 Short Interest Hits a 15-Year High
Short selling is when investors bet that a stock’s price will fall. The more short interest you see, the more people expect things to get worse.
Right now, median short interest across Russell 3000 stocks has climbed to 4.3%. Data compiled by The Kobeissi Letter confirms this is the highest level in 15 years. More strikingly, it sits a full percentage point above where short interest peaked during the brutal 2022 bear market.
That’s a meaningful distinction. The 2022 downturn wiped out significant value across equities and crypto alike. The fact that short sellers are now even more aggressive than they were then tells you something important about current market expectations.
Energy Sector Short Interest Doubles at Record Speed
The energy sector is telling an even more alarming story right now.
Short interest in the State Street Energy Select Sector SPDR ETF, known as XLE, has surged to its highest point since the 2008 financial crisis. According to The Kobeissi Letter, short interest in the sector has literally doubled over the last few weeks. They describe it as “the most rapid jump this century.”
That’s an extraordinary statement. Doubling in a matter of weeks, during a single quarter, puts this move in a category of its own.
![Bar chart comparing leveraged long-to-short ETF trading volume ratios from 2020 to 2026, highlighting the sharp drop from 3.0 in October to approximately 1.1 in March 2026]
SPY Put Volume Spikes to Liberation Day Levels
Options traders are joining the party too. Put options — which are essentially bets that prices will fall — on the State Street SPDR S&P 500 ETF Trust (SPY) have spiked to 8.6 million contracts.
That’s the highest volume since April 2025’s “Liberation Day” tariff shock, which sent markets into a tailspin when sweeping new trade tariffs hit the headlines. The fact that put volume is back at those levels suggests traders are once again bracing for serious downside.
Put options aren’t just expressions of fear. They’re actual financial commitments. When volumes hit records, real money is moving behind the pessimism.
Leveraged ETF Ratio Tells the Clearest Story
Perhaps the most telling data point comes from leveraged ETF trading patterns. The ratio of leveraged long-to-short ETF trading volume has fallen to approximately 1.1.
To translate that into plain English: the number of people using leveraged products to bet on rising prices is now almost exactly equal to those betting on falling prices. The Kobeissi Letter put it simply — “trading activity in leveraged short ETFs is now nearly equal to that of leveraged long ETFs.”
Back in October, that same ratio sat at 3.0. Bulls outnumbered bears by a wide margin. Now that gap has essentially vanished. For context, the ratio fell to 0.4 during the 2008 financial crisis bottom, meaning short ETF volume actually exceeded long ETF volume by around 150% at the absolute worst point of that crash.
We’re not at 2008 levels yet. But the trajectory is pointing in that direction.
Does Extreme Bearishness Mean a Bounce is Coming?
Here’s where it gets genuinely interesting. When market positioning becomes this one-sided, history suggests something counterintuitive can happen.
Contrarian investors often point out that when everyone is already betting on a crash, there may be no one left to sell. Markets have historically shown sharp reversals right when pessimism peaks. The thinking goes: if everyone who wants to sell has already sold, prices have nowhere to go but up.
But — and this is a big but — that pattern assumes the worst is already priced in. Right now, escalating geopolitical tensions and mounting macroeconomic headwinds mean the worst might not actually be priced in yet. The bearish bets could simply be correct.
So the honest answer is that nobody knows for certain. What’s clear is that investor positioning has reached historically extreme levels across sentiment, short interest, options hedging, and ETF flows all at once. That combination is rare. How markets respond to it from here is the question every trader is trying to answer.
Whether you’re a casual market watcher or someone with real money on the line, these numbers are worth knowing about. The signals don’t guarantee a crash or a recovery. But they do tell you that the people managing serious capital are genuinely worried — and they’re putting their bets where their convictions are.