XRP jumped about 3% from its March 27 low of $1.31, briefly reclaiming the $1.35 area. Sounds encouraging. But dig into the chart patterns, derivatives data, and on-chain signals, and this bounce starts looking a lot more fragile than it appears.
Since peaking at $1.60 on March 17, XRP has already dropped 18%. And several technical and market signals suggest the selloff might not be finished yet.
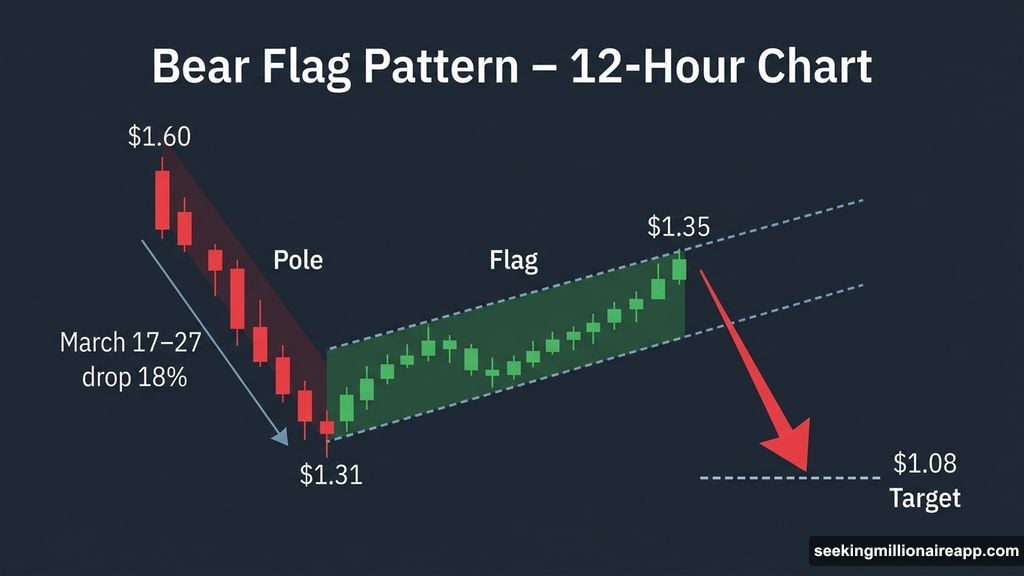
A Bear Flag Pattern Takes Shape on the 12-Hour Chart
The 12-hour chart tells an uncomfortable story. XRP’s drop from $1.60 to $1.31 between March 17 and March 27 formed what analysts call the “pole” of a bear flag. The current 3% bounce is now building the “flag” portion — a gentle rising channel that typically signals one thing: another leg down is coming.
Bear flags work like a coiled spring. The initial sharp drop creates the pole. Then the price drifts slowly upward in a narrow channel, lulling buyers into thinking the worst is over. But when the lower trendline breaks, the pattern typically triggers a drop roughly equal to the original pole.
In XRP’s case, that measured move points toward the $1.08 zone — the lowest level the token would have seen since early February 2026.
![XRP bear flag pattern forming on 12-hour chart with RSI hidden bearish divergence signal visible on TradingView]
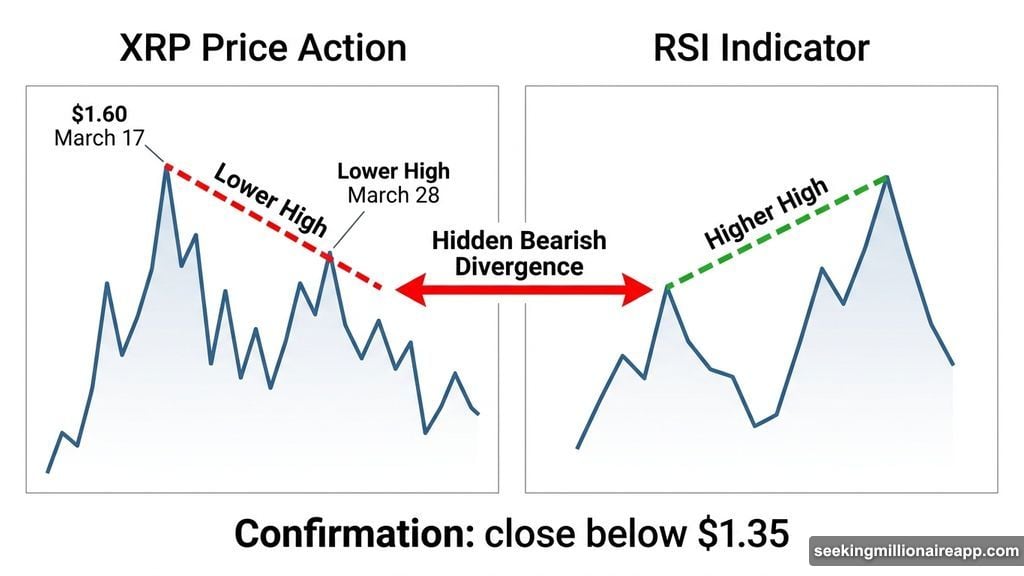
Hidden Bearish Divergence Adds Another Red Flag
The Relative Strength Index (RSI) is piling on the concern. Between February 6 and March 28, something quietly troubling appeared on the 12-hour chart. XRP’s price is forming a lower high, but the RSI is forming a higher high at the same time. That mismatch is called a hidden bearish divergence.
Hidden bearish divergence doesn’t signal a reversal. Instead, it points to a continuation of the existing downtrend. Momentum looks stronger than the price action suggests on the surface, which makes the bounce feel more convincing than it actually is.
That said, the divergence hasn’t confirmed yet. For confirmation, the next 12-hour candle needs to close below $1.35. If XRP instead clears $1.35 and holds above it, the bearish setup gets delayed. Full invalidation only happens above $1.60 — the original peak where the pole began.
Open Interest Is Rising, but Long-Term Holders Are Quietly Leaving
The derivatives market adds another layer of concern. Since the bounce began, XRP’s open interest climbed from $737.72 million to $759.21 million, a 2.9% increase. At the same time, the funding rate moved from -0.011% to -0.003%, meaning new long positions are being opened into this bounce.
That combination is actually a warning sign. Rising open interest during a bear flag bounce typically means leveraged traders are betting on recovery. But if the flag breaks down, those fresh longs become forced liquidations — which can accelerate any drop considerably.
The spot market isn’t offering any reassuring backup either. According to Glassnode data, the Hodler Net Position Change metric — which tracks accumulation by longer-term wallets holding for 155 days or more — sat around 238 million XRP between March 19 and March 25. Since March 25, that figure has dropped to roughly 229.78 million XRP. That’s about 8.25 million tokens, or a 3.47% reduction, quietly exiting right as the price bounces.
So you’ve got leveraged traders going long while conviction holders are heading for the exits. That’s a setup that favors the bears, not the bulls.
What XRP Needs to Avoid an 18% Drop
The critical level right now is $1.35. A clean 12-hour close above that number delays the bearish scenario and opens the door to $1.37 and then $1.40 as the next resistance targets.
But if XRP fails to hold $1.35 and the $1.31–$1.32 support zone gives way, the measured move from the bear flag activates. That projects a roughly 18% decline from the breakdown point, targeting the $1.08 area.
The only bullish outcome that fully erases this setup is a push back above $1.60. That would break the lower-high sequence that’s defined XRP’s trading pattern throughout 2026 and reopen the path toward higher prices.
Right now, though, the chart, the derivatives, and the on-chain behavior are all pointing the same direction. Whether spot buyers step in alongside the recent longs will matter enormously. If they do, some support can absorb the selling pressure. If they don’t, there’s not much standing between the current price and $1.08.
The $1.35 level is the one to watch. It’s the difference between a delayed bearish setup and an 18% breakdown that makes new yearly lows look very real.