Zcash just jumped 14% in a single day. The privacy coin now sits above $437, capping a wild three-month run that’s seen prices soar over 1,130%.
Most altcoins struggle to hold gains. But ZEC keeps climbing, month after month. So what’s driving this rally? And more importantly, can it actually reach the projected $1,500 target without collapsing first?
Let’s dig into the charts, the leverage data, and the real risks lurking beneath this explosive move.
The Hidden Signal That Keeps Bulls Confident
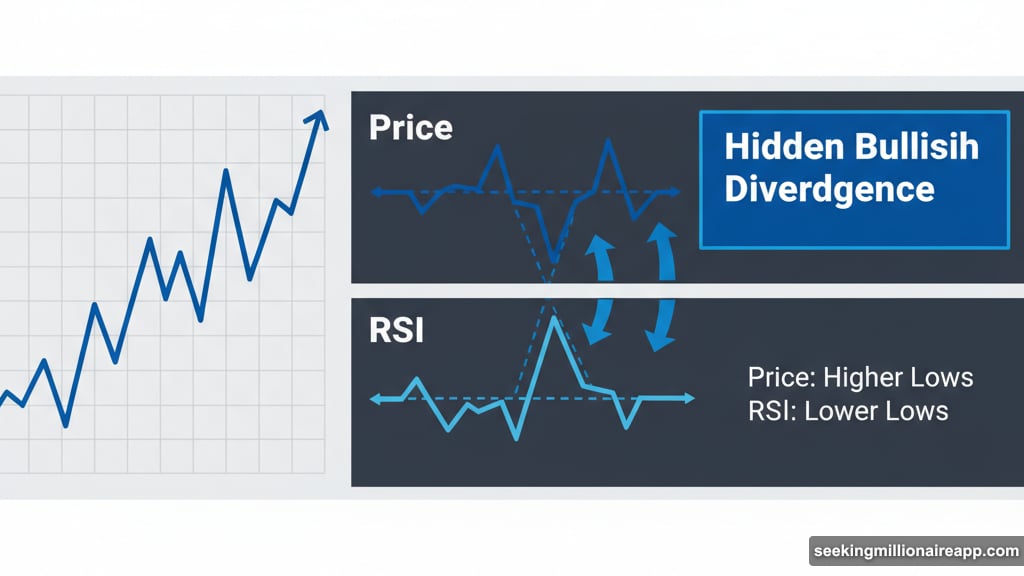
Between early October and late October, something interesting showed up on ZEC’s charts. The price formed higher lows, which looks bullish. But the Relative Strength Index created lower lows during the same period.
This pattern has a name: hidden bullish divergence. It typically signals that an uptrend will continue rather than reverse. Think of it as the market catching its breath before running higher again.
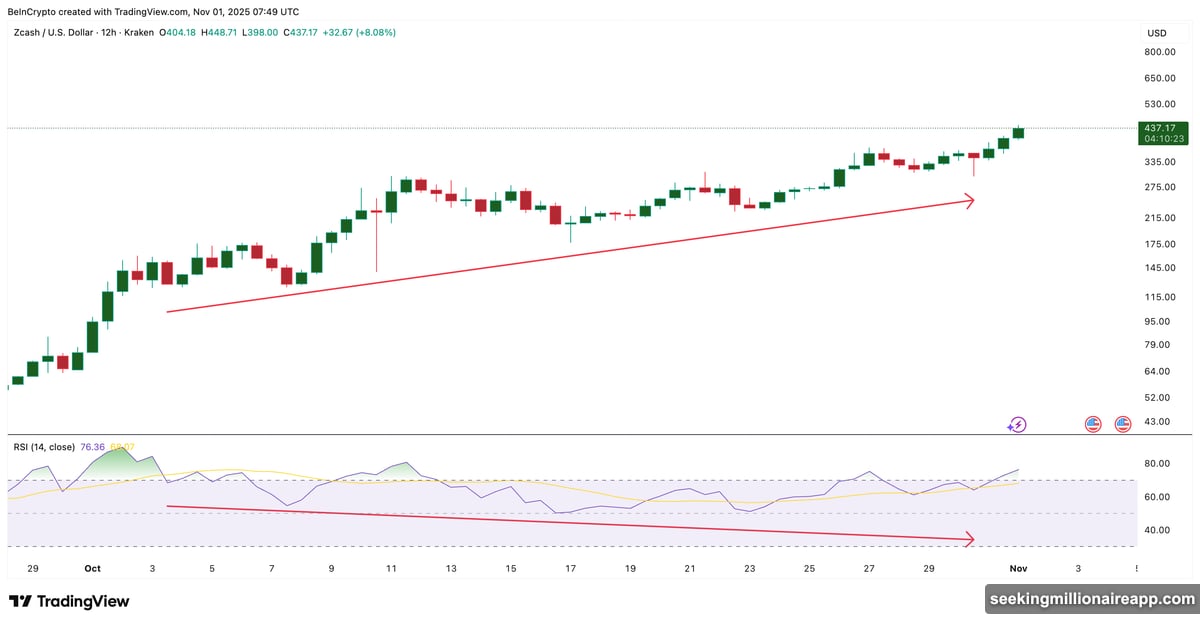
Plus, ZEC’s RSI still hovers above 70. That’s overbought territory in traditional analysis. Yet here, it just confirms strong buyer control. Short profit-taking phases happen, sure. But traders keep coming back to buy more rather than exit entirely.
Still, an RSI this elevated can eventually trigger pullbacks. So far though, each dip gets bought quickly. That resilience matters more than the absolute RSI number.
Big Money Keeps Flowing Into Zcash
The Chaikin Money Flow indicator tracks whether large players are buying or selling. For ZEC, it’s been positive for weeks without dropping below zero. Currently it sits around 0.05, showing steady institutional interest.
Here’s what makes this significant. The CMF briefly weakened toward the end of October as some whales took profits. But it never actually went negative. And on November 1st, it curled back up immediately.
That quick reversal suggests conviction. Big traders didn’t just exit and walk away. They took some profit, watched the price hold, then started buying again. If CMF climbs above 0.14 and pushes toward 0.24, another buying wave could kick off.
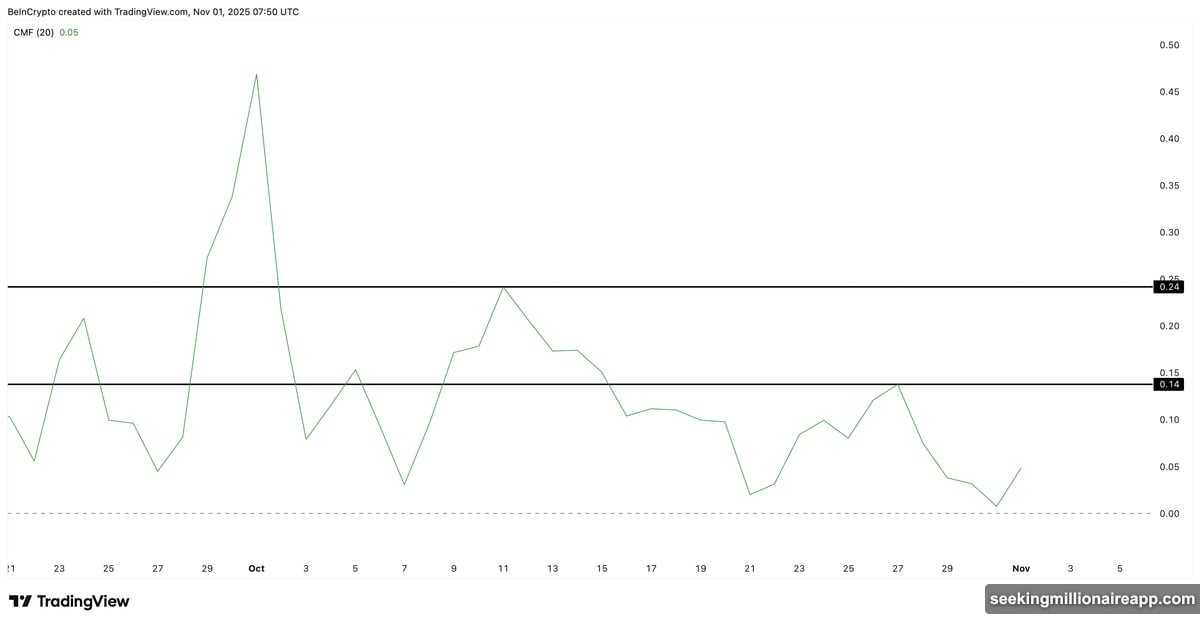
Moreover, consistent positive money flow during a 1,000%+ rally is unusual. Most coins see heavy profit-taking that turns CMF negative. ZEC hasn’t experienced that yet. So the underlying momentum remains intact.
The Leverage Trap That Could Wreck Everything
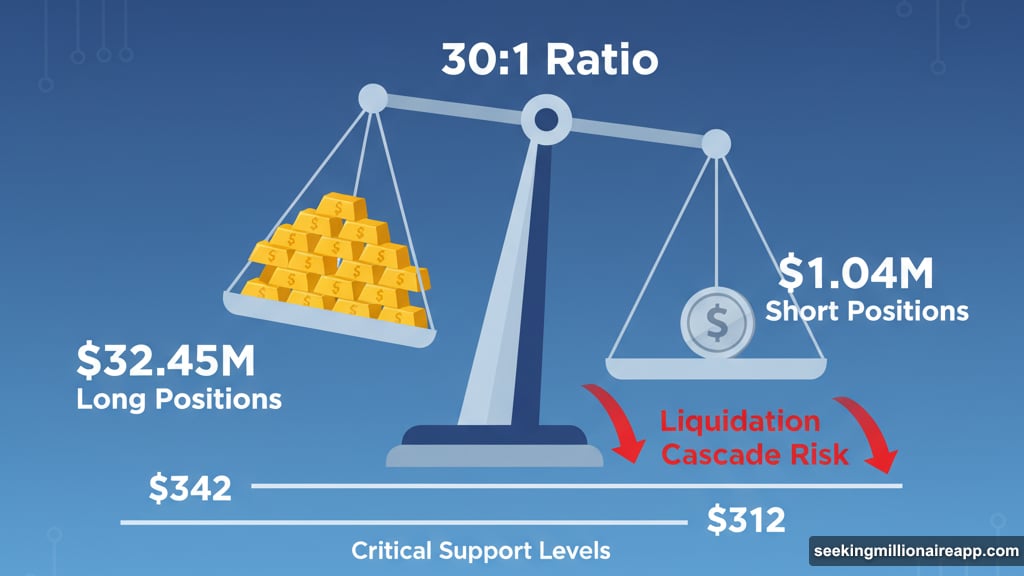
Now for the uncomfortable part. Leveraged traders have piled into ZEC at record levels. According to Bybit’s liquidation data, long positions total about $32.45 million. Short positions? Just $1.04 million.
That’s a 30-to-1 ratio favoring longs. Everyone’s betting on higher prices. And that creates a dangerous setup.
When leverage gets this lopsided, even small drops trigger cascading liquidations. Traders get forced out of positions, which creates selling pressure, which forces out more traders. It snowballs fast.
The critical support levels sit at $342 and $312. Hold those, and the rally continues. Break below $312, and a liquidation cascade likely begins. That makes these levels far more important than typical Fibonacci supports.
In fact, the liquidation map shows that breaking $312 would wipe out essentially all existing long positions. That’s not hyperbole. It’s math. So bulls need to defend $342 at minimum to keep this move alive.
Flag Pattern Points to $1,500 Target
Despite the leverage risk, the technical structure looks solid. ZEC is trading within a classic flag-and-pole breakout pattern. This setup often precedes extended rallies.
The breakout above $438 already confirmed the continuation. Now Fibonacci projections give us clear targets ahead. The next levels sit at $594, $847, and $1,256. And the full pole projection? That lands at $1,567, roughly 250% above current prices.
Here’s the progression that needs to happen. ZEC needs to clear $594 first, which would confirm the breakout is real rather than a fake move. Then $847 becomes the next test. That level marks a psychological barrier where previous rallies stalled.
If ZEC pushes past $847, the path to $1,256 opens up. And at that point, $1,567 becomes genuinely possible rather than just a theoretical target. But each level will bring profit-taking. Each pause could trigger that leveraged liquidation scenario.
So yes, $1,500 is achievable based on the pattern. But the journey there won’t be smooth. Any drop below $342 counts as a warning sign. Below $312 means trouble. And if ZEC somehow crashes under $245, the entire bullish structure collapses.
What Traders Need to Watch Now
The confluence of bullish signals and extreme leverage creates an unusual situation. On one hand, every indicator points up. Money keeps flowing in. The pattern projects higher. Momentum hasn’t broken.
On the other hand, leverage creates fragility. One bad day could turn into a liquidation nightmare. And at these price levels, volatility will stay high no matter what.
That’s why $342 matters so much. As long as ZEC holds above that 0.618 Fibonacci level, every dip looks like healthy profit-taking rather than trouble. Buyers can confidently step in knowing the structure remains intact.
But lose $342, and suddenly everyone questions whether the rally is over. Panic selling starts. Leveraged positions get liquidated. And before you know it, ZEC is testing $312 where the real bloodbath begins.
For now, bulls control this market. The technical setup still favors higher prices. But pretending the leverage risk doesn’t exist would be foolish. This rally can continue, maybe even hit $1,500. Just don’t expect the path there to be risk-free.