XRP is flashing some serious warning signs on the chart right now. A well-known bearish pattern has formed, a key momentum indicator is signaling trouble, and long-term holders have been quietly dumping their bags. Yet somehow, the price hasn’t collapsed yet.
So what’s holding it up? Institutional money pouring into XRP ETFs. And that tension between two very different groups of investors is creating one of the most interesting setups in crypto right now.
Let’s break down what’s actually happening and what levels you should be watching.
Hidden Bearish Divergence Fires on the 8-Hour Chart
XRP was trading around $1.41 on April 23. On the surface, that looks fairly quiet — flat on the week, flat on the month. But zoom into the 8-hour chart and a different story emerges.
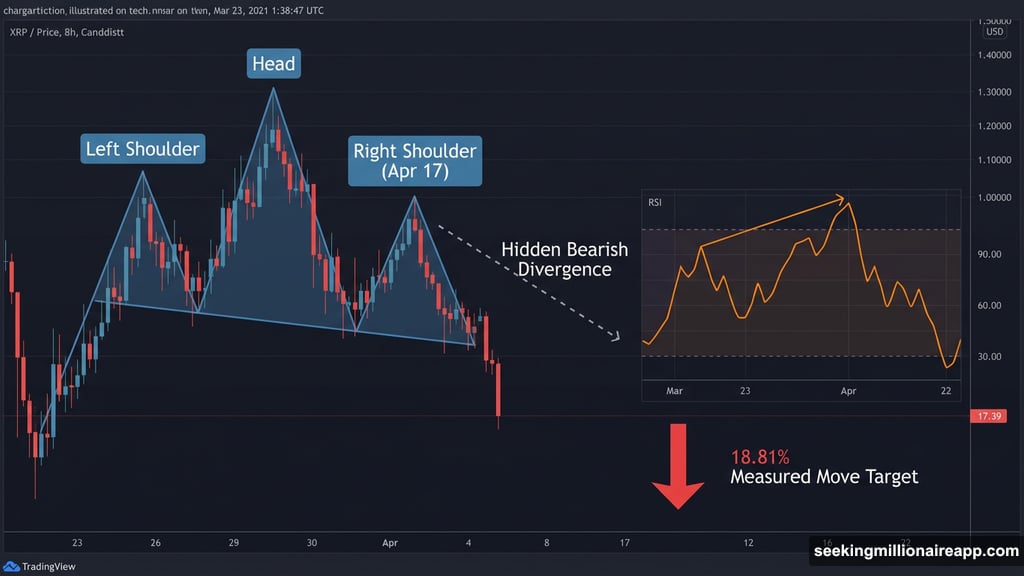
Between March 23 and April 22, XRP’s price made a slightly lower high. Meanwhile, the Relative Strength Index (RSI) — a momentum indicator that measures buying and selling pressure — made a higher high. That mismatch is called a hidden bearish divergence.
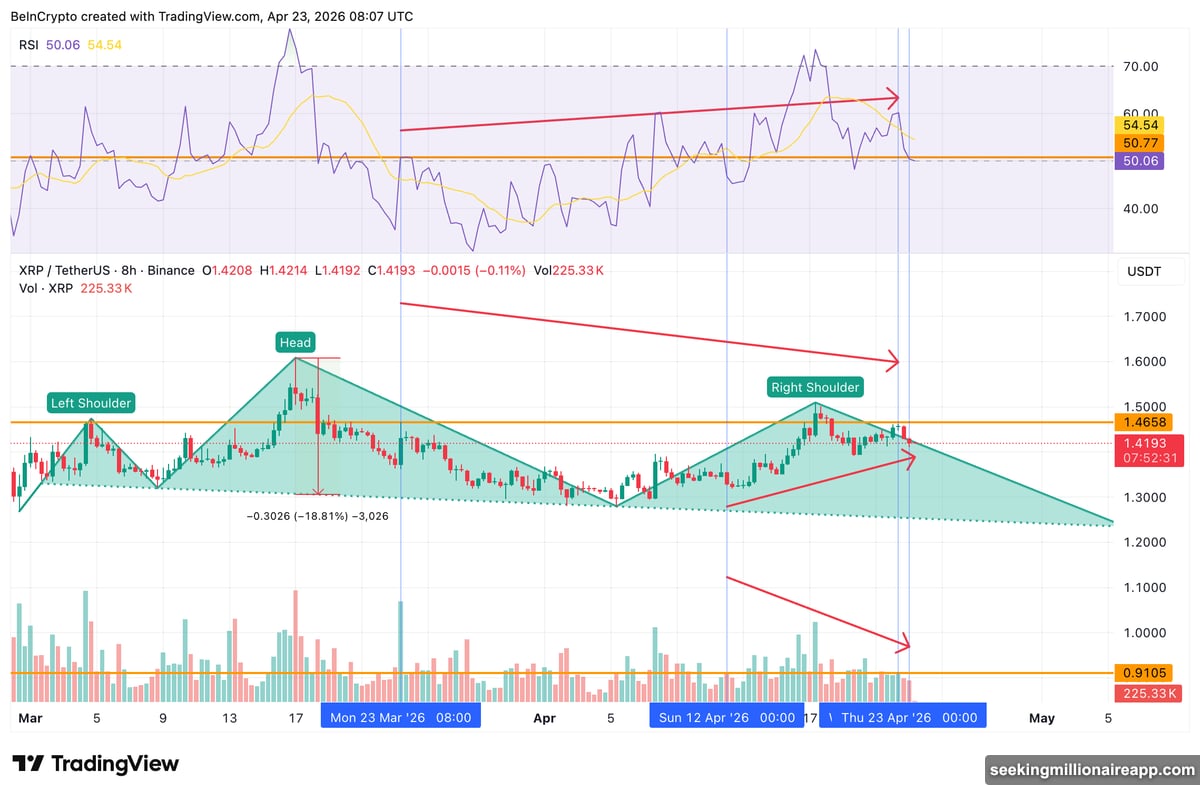
In plain terms, it means the bounce is losing steam even while price looks okay. And in a broader downtrend, this kind of signal usually means the downtrend is getting ready to resume.
Plus, this divergence appeared right inside a head-and-shoulders pattern — one of the most reliable bearish reversal setups in technical analysis. The right shoulder of that pattern topped out on April 17. So now the chart has two bearish signals stacking on top of each other.
Fading Sell Volume Delays the Breakdown
Here’s the twist. Despite the bearish signals, the actual selling pressure has been weakening.
Between April 12 and April 23, the red (sell-side) volume bars on the 8-hour chart trended lower while XRP’s price trended higher. That’s not what bears want to see. For a breakdown to play out with conviction, selling pressure needs to accelerate — not fade.
Think of it like a car rolling toward a cliff. The bearish setup is the slope pointing downward. But fading volume is like someone slowly pressing the brakes. The car is still heading toward the edge, just slower than expected.
So the technical picture says breakdown is coming. The volume tape says not just yet. That creates a near-term stalemate where the pattern stays intact but the 18.81% measured move needs more fuel before it fires.
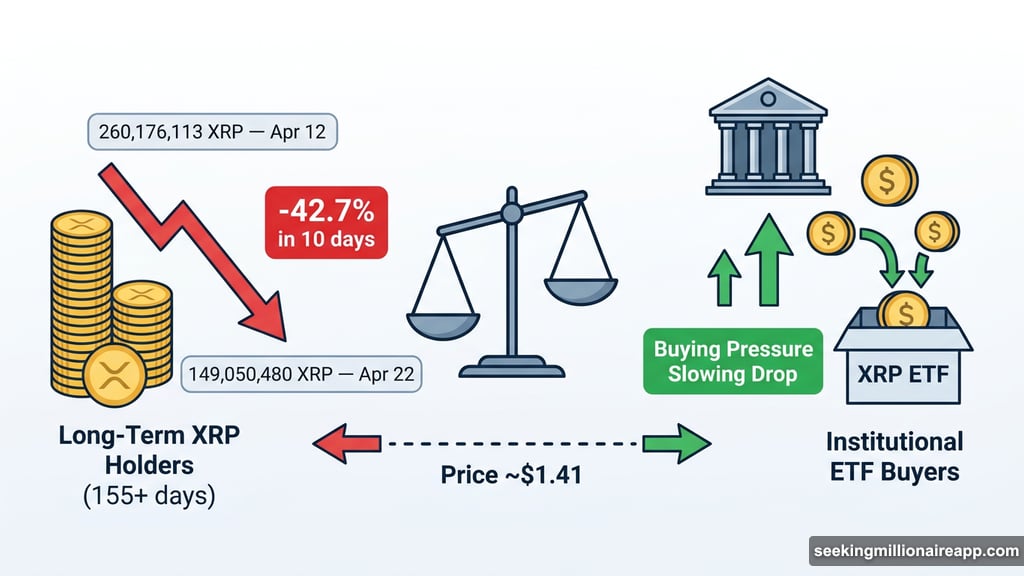
Long-Term Holders Are Cashing Out
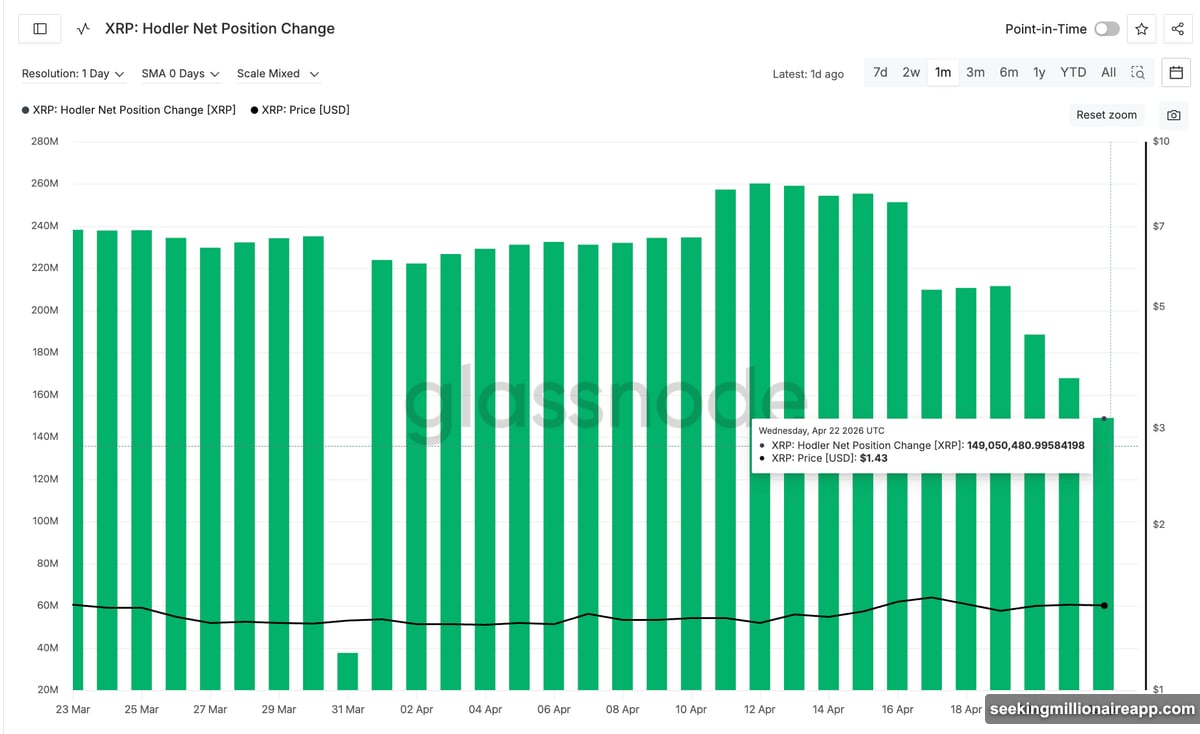
On-chain data from Glassnode adds another layer to this story — and it’s not bullish for XRP.
The hodler net position change, which tracks what long-term holders (those who’ve held for 155 days or more) are doing with their coins, sat at 260,176,113 XRP on April 12. By April 22, that number had dropped to 149,050,480 XRP. That’s a decline of roughly 42.7% in just ten days.
In other words, long-term believers in XRP were quietly trimming their positions — and they started doing it before the right shoulder even formed on April 17. That timing matters. It suggests experienced holders were already losing confidence in the bounce before most people noticed.
However, institutional buyers told a completely different story over that same period.
XRP ETFs Logged Inflows on 8 of 9 Trading Days
US spot XRP ETF products have been on a near-unbroken buying streak. According to data from SoSoValue, these ETFs logged net inflows on 8 of the last 9 trading days, covering nearly two weeks starting April 10.
The one exception was April 21, which recorded zero net flow — but crucially, no outflows either. So institutions weren’t selling. They just took a breath.
Some of the individual day totals stand out. April 17 alone saw $13.74 million in inflows. April 20 brought in another $3 million. April 22 added $2.42 million more. That’s steady, consistent accumulation through the exact same window when long-term hodlers were distributing.
This split is the real story right now. Retail long-term holders are betting the chart breaks down. Institutional money flowing through ETFs is betting the bounce continues. One of them is going to be very wrong.
The Price Levels That Settle This Debate
The XRP chart lays out the key decision zones clearly.
XRP has already lost the 0.236 Fibonacci level at $1.43, which had been acting as the immediate resistance cap. Below current price, the 0.382 Fib at $1.38 and the 0.5 Fib at $1.34 represent the first downside tests.
But the real line in the sand sits at $1.30, the 0.618 Fibonacci level. A daily close below that level clears the path toward $1.25 and then triggers the full measured move projection. That projection points to $1.18 initially, with an extension target down to $1.01 — representing the full 18.81% decline from the breakdown point.
On the upside, XRP needs to reclaim $1.50 (the right shoulder cap) on an 8-hour close to put the bearish structure on shaky ground. A move above $1.60 — the head peak of the head-and-shoulders pattern — would fully invalidate the setup and hand the win to the ETF bulls.
So here’s where things stand. Above $1.50, the bears are wrong and ETF demand wins. Below $1.30, hodler capitulation spreads and the 18% flush toward $1.01 becomes the next destination. Everything between those two levels is just noise while both sides fight it out.
The chart has made its case. Volume and ETF flows are buying time. But if selling pressure returns and hodler distribution accelerates, that breathing room disappears fast.