The Bitcoin price chart looks encouraging right now. But the story underneath it is far more complicated.
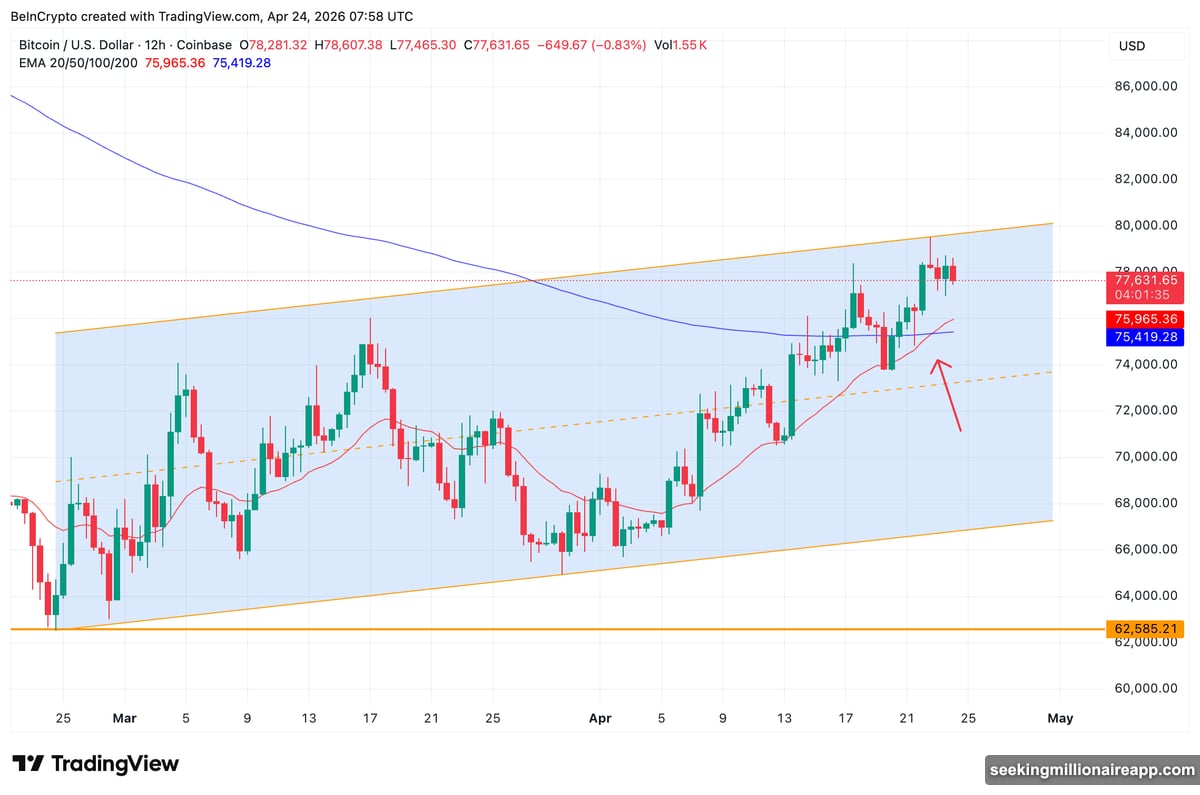
BTC trades at $77,670 as of April 24, sitting inside a rising channel that has defined price action since February 24. The rally back above $77,000 feels constructive on the surface. Yet two on-chain signals are pulling in completely opposite directions — and that split reveals exactly what the biggest wallets are doing right now.
Whale Accumulation Pattern: Opportunistic, Not Conviction-Driven
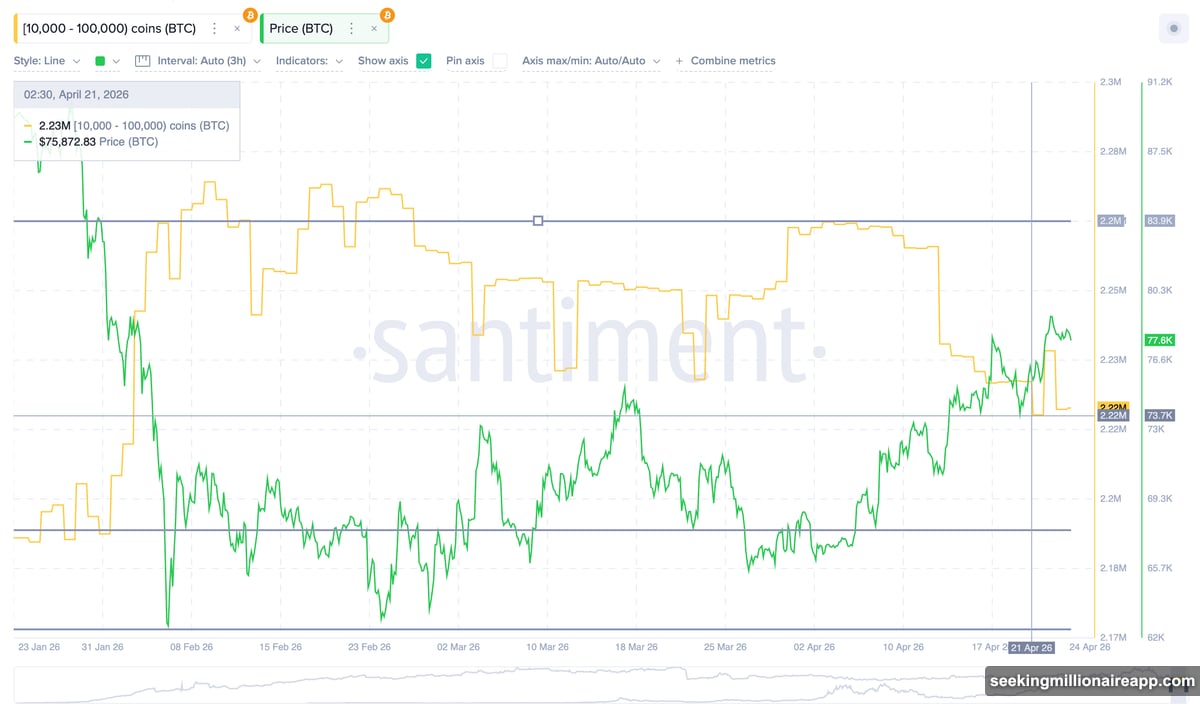
The 10,000 to 100,000 BTC whale cohort has a very consistent playbook. They buy local bottoms, ride the bounce, and step back out.
Santiment data makes this pattern crystal clear. This cohort jumped its holdings from 2.26 million to 2.27 million BTC within four days of Bitcoin’s February 6 low under $62,000. Then they added again — from 2.23 million to 2.26 million BTC — between March 23 and early April as price bottomed near $67,700. Now, they’re buying again, starting April 22.
So what triggered the April 22 buy? A technical signal on the 12-hour chart. The 20-period Exponential Moving Average (EMA) — a trend line that gives more weight to recent price candles — crossed above the 200-period EMA. That bullish crossover formed the exact same day whales restarted accumulating.
That timing is not a coincidence. It points to an opportunistic trade, not a deep conviction bet on Bitcoin’s direction.
ARK Invest Data Adds Important Context
ARK Invest’s Q1 2026 Bitcoin Quarterly report offers some useful background here. Big money buyers expanded their holdings by 69% during Q1’s 22% drawdown — growing from 2.13 million to 3.60 million BTC. ARK described it as the fastest accumulation pace since the 2020 cycle.
But here’s the important distinction. That conviction-level buying happened around $68,200. The current whale activity is happening at $77,000.
These are bounce buyers. Not bottom buyers. The difference matters enormously for what comes next.
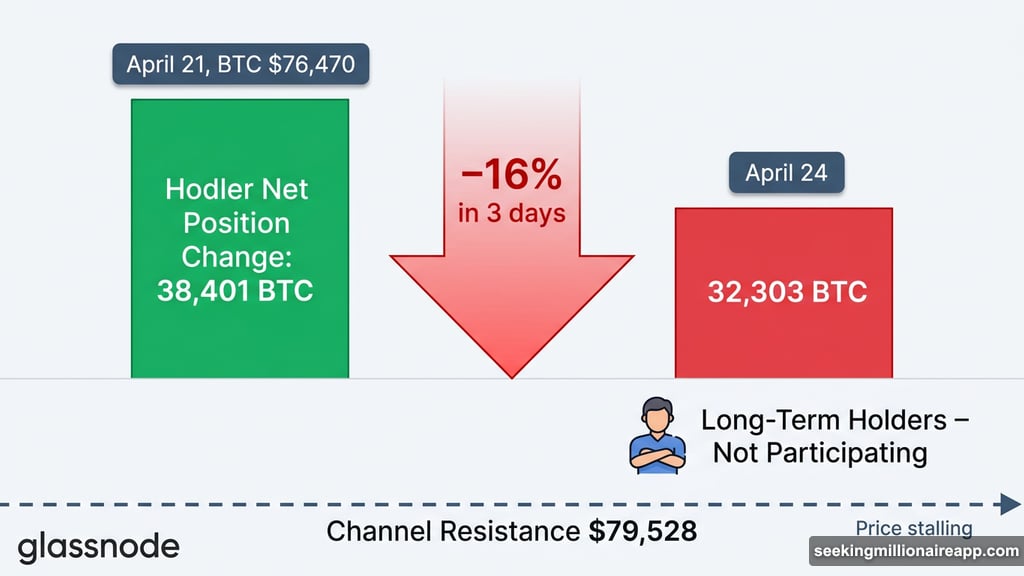
Hodler Net Position Change Drops 16% in Three Days
If this rally were the beginning of a real, sustained recovery, mid-term holders would be adding exposure. They are not.
Glassnode’s Hodler Net Position Change metric tracks whether conviction holders — the people who buy and hold for months — are accumulating or distributing. On April 21, with BTC at $76,470, this metric peaked at 38,401 BTC. By April 24, that reading had dropped to roughly 32,303.
That’s a 16% collapse in just three days.
Long-term holders are not chasing this bounce. And when the people with the strongest hands refuse to participate in a rally, it raises serious questions about whether the move has real staying power.
Channel Resistance Holds Firm at $79,528
Bitcoin pushed to the top of its rising channel at $79,528 on April 22 before reversing. That rejection fits the whale pattern perfectly.
The bounce trade ran straight into the same upper trendline that has capped every rally since February. Without hodler support behind it, the move stalled out. Whales bought the dip and rode it to resistance. Classic opportunistic behavior.
So where does price go from here? Two clear scenarios exist.
A daily close above $79,528 would flip the structure. That would open the channel ceiling near $80,000, and hodler conviction would likely follow a confirmed breakout. But rejection at current levels exposes the 0.236 Fibonacci retracement at $75,523 as the first downside test.
Breaking below $75,523 opens up $73,046 and then $71,043. A deeper slide toward the 0.786 Fibonacci level at $66,190 would unlock the channel floor near $62,559. The current 10% bounce can unwind fast if whales decide there’s nothing left to ride.
What This Split Actually Means
Two groups are looking at the same Bitcoin price and drawing completely different conclusions.
Whales see a technical bounce worth trading. They spotted the EMA crossover, accumulated quickly, and rode the move toward channel resistance. That’s disciplined, short-term positioning — not a statement about where Bitcoin goes over the next few months.
Long-term hodlers see something different. They’re not adding exposure here, which suggests they either don’t believe the bottom is confirmed or they’re waiting for a clearer structural signal before committing fresh capital.
That divergence is what makes $79,528 so significant right now. It’s not just a trendline. It’s the line that separates a genuine breakout from another whale-led bounce that fades back into the channel.
Until Bitcoin closes decisively above that level with hodler participation backing the move, skepticism is warranted. The bounce looks real. Whether it has legs is a very different question.