
Ethereum’s price chart is sending a familiar distress signal. But the traders underneath the chart are behaving very differently this time around.
A bearish divergence on the Relative Strength Index (RSI) fired again on April 22. This is the same pattern that triggered a near 9% price drop just five weeks ago. However, whale behavior has flipped since that April correction, and the derivatives market tells a different story too. So while the warning sign is identical, the outcome may not be.
Let’s walk through what the data actually shows and what price levels matter most right now.
RSI Divergence Fires Again on Ethereum
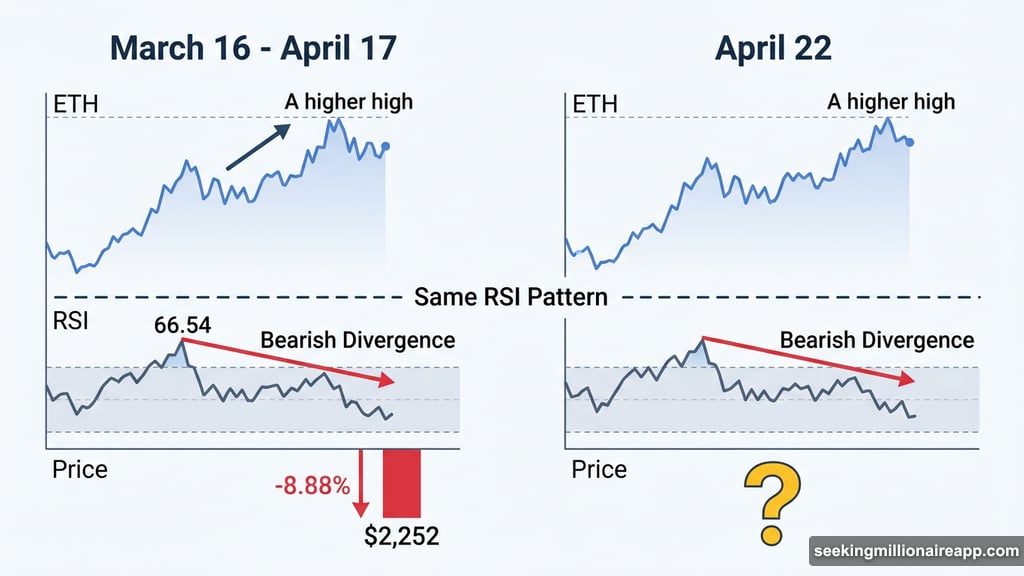
The core warning comes from a classic technical pattern called bearish divergence. Here is the simple version: when price climbs to a new high but the RSI momentum indicator does not follow, something is weakening under the surface.
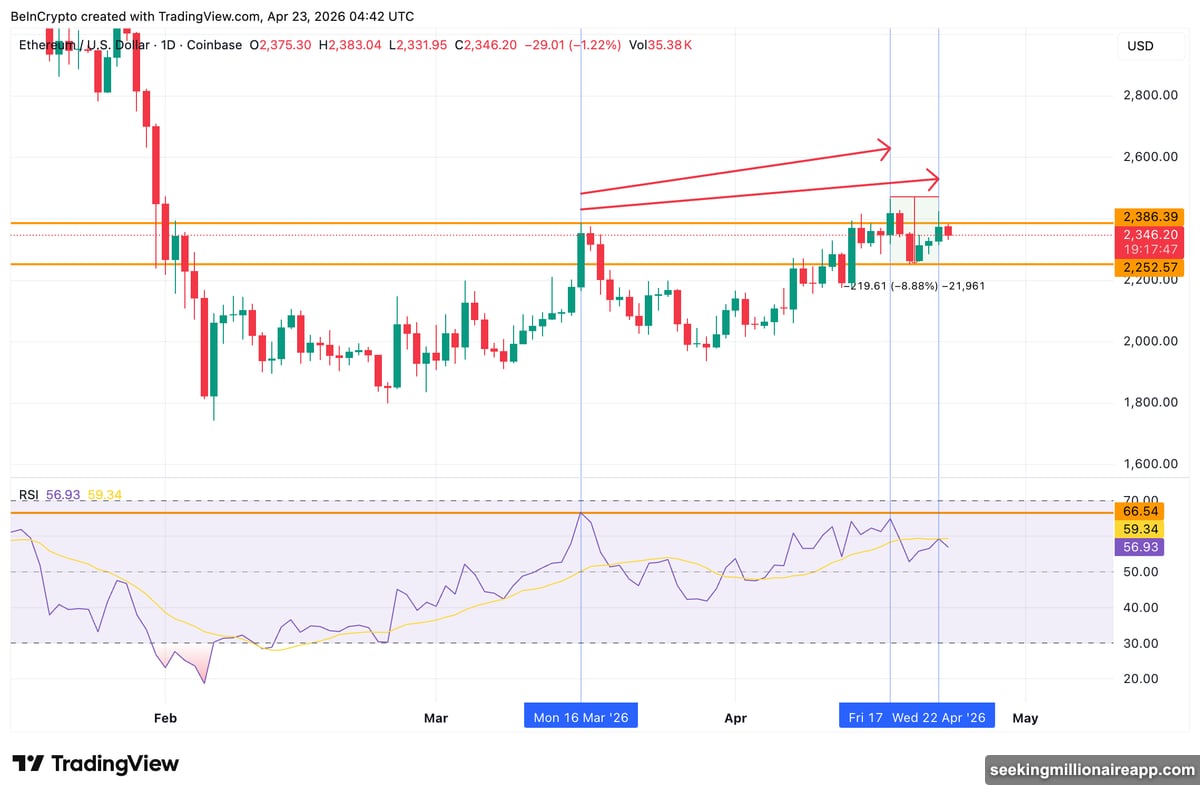
Ethereum’s RSI peaked at 66.54 on March 16. When ETH price pushed to a higher high on April 22, the RSI made a lower high instead of matching that peak. That mismatch signals fading momentum.
The last time this exact pattern appeared was between March 16 and April 17. Back then, it preceded an 8.88% correction that brought ETH down to around $2,252 before the market found its footing. So the signal has a track record worth paying attention to.
Whale Accumulation Looks Different This Cycle
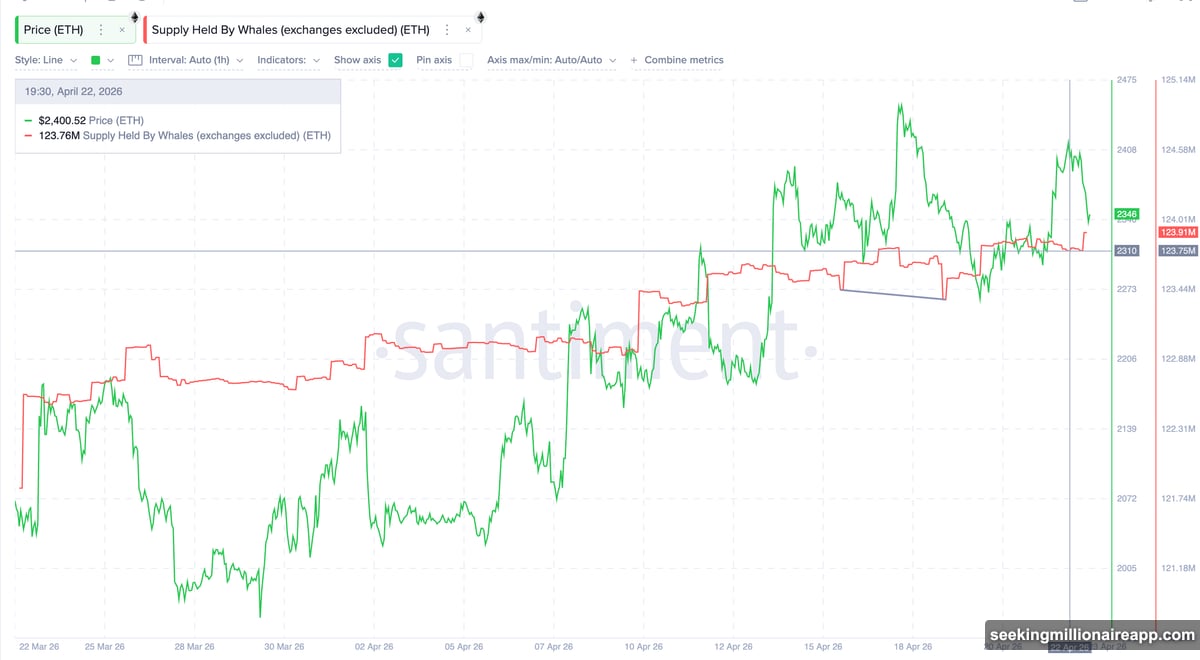
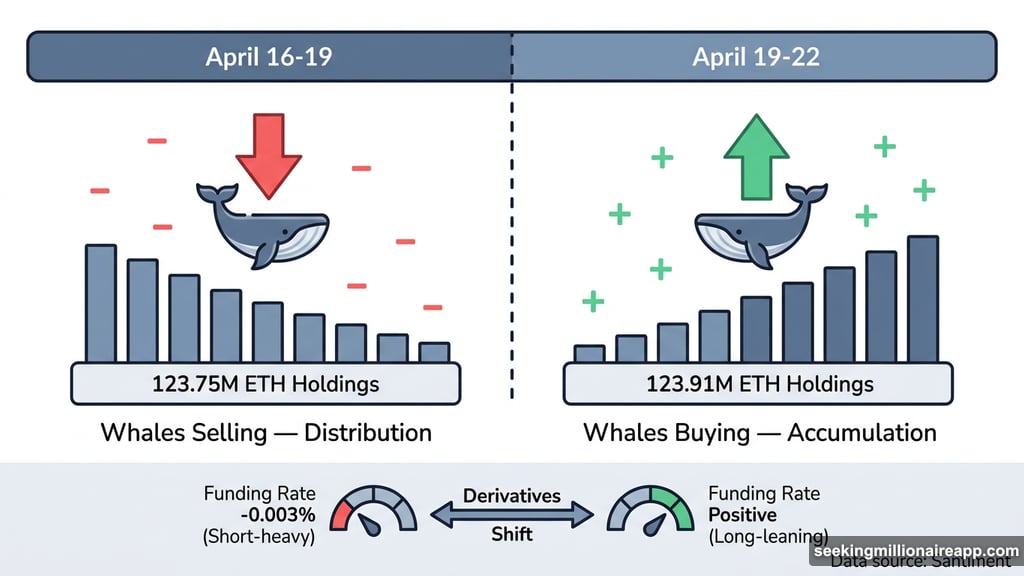
Here is where things get interesting. Last time this divergence fired, Ethereum whales were selling. Data from Santiment shows whale holdings dropped during the April 16-19 unwind, which added pressure to the decline.
This time, whale behavior flipped. Holdings rose from 123.75 million ETH on April 19 to 123.91 million ETH by April 22. That is accumulation, not distribution.
The shift matters because whale positioning was the key difference between a manageable dip and a sharper selloff last cycle. However, analysts are quick to point out that whales can reverse course fast. Sudden reserve dumps are a well-documented pattern with this cohort. So the accumulation trend is encouraging, but it needs to hold.
Funding Rates Flipped. That Changes the Math.
The derivatives picture adds another wrinkle. Ethereum open interest currently sits near $12.3 billion, roughly comparable to the reading when the April 17 divergence triggered. But the funding rate tells a completely different story.
On April 17, funding sat at -0.003%, meaning the market leaned short. That short-heavy positioning actually helped ETH recover faster. When price bounced off the $2,252 low, those short traders were forced to cover their positions, which amplified the rebound.
Now, funding sits slightly positive. Traders are leaning long, not short.
That flipped positioning creates the opposite dynamic. If a pullback begins, long liquidations would add to the downside pressure instead of squeezing shorts into a recovery bounce. The cushion that helped ETH recover quickly in mid-April simply is not there right now.
That said, funding rates are not at extremes in either direction. So a forced squeeze or immediate cascade seems unlikely at current levels.
Key Price Levels That Decide the Next Move
With the divergence active and positioning mixed, the ETH price chart becomes the real arbiter. Several specific levels define what happens next.
On the upside, ETH needs a daily close above $2,377 to invalidate the bearish setup. That level sits at the 0.236 Fibonacci retracement and currently acts as resistance capping any bounce attempt. A push through $2,377 opens the path toward $2,455, and extended targets sit at $2,517, $2,580, $2,783, and eventually $3,112.
On the downside, $2,252 is the first meaningful test. This level is not just a technical line. Glassnode data shows 716,028 ETH sitting in the $2,231 to $2,250 cost basis range. Those holders did not sell during the April 17-19 correction, which is precisely why $2,252 held as support. They have real conviction at that price.
If $2,252 breaks, the next major demand zone sits between $2,067 and $2,085. That zone holds approximately 1,417,672 ETH at cost basis, nearly double the supply anchored at $2,252. Breaking below that exposes ETH to levels closer to $1,935.
$2,252 Separates a Shallow Dip From a Deeper Drop
The $2,252 level is not just a number on a chart. It is the dividing line between two very different scenarios.
If whales hold their current accumulation posture and ETH bounces from that level again, this second divergence resolves more quietly than the first. The bull case remains intact.
But if whale reserves start declining again, the primary difference between this setup and the April 17 setup disappears. And with funding rates leaning long rather than short, the recovery mechanism that helped ETH snap back last time is gone too.
The bearish warning is real. But so is the shift in whale behavior. Right now, both sides have legitimate arguments, and the chart will settle the debate. Watch the $2,252 level closely. It is where the next chapter of this ETH trade begins.