The crypto market caught a serious tailwind today. A shocking inflation reading sent investors rushing into riskier assets — and digital currencies were first in line.
The total crypto market cap climbed 0.62% to $2.50 trillion. Bitcoin gained ground before profit-taking trimmed its advance. And MemeCore absolutely ran, posting a 5.6% daily gain on top of an already staggering 96% monthly rally. Here’s what moved markets and what it could mean for the days ahead.
Soft PPI Data Sent Shockwaves Through Risk Assets
The biggest catalyst today was a US inflation surprise nobody saw coming.
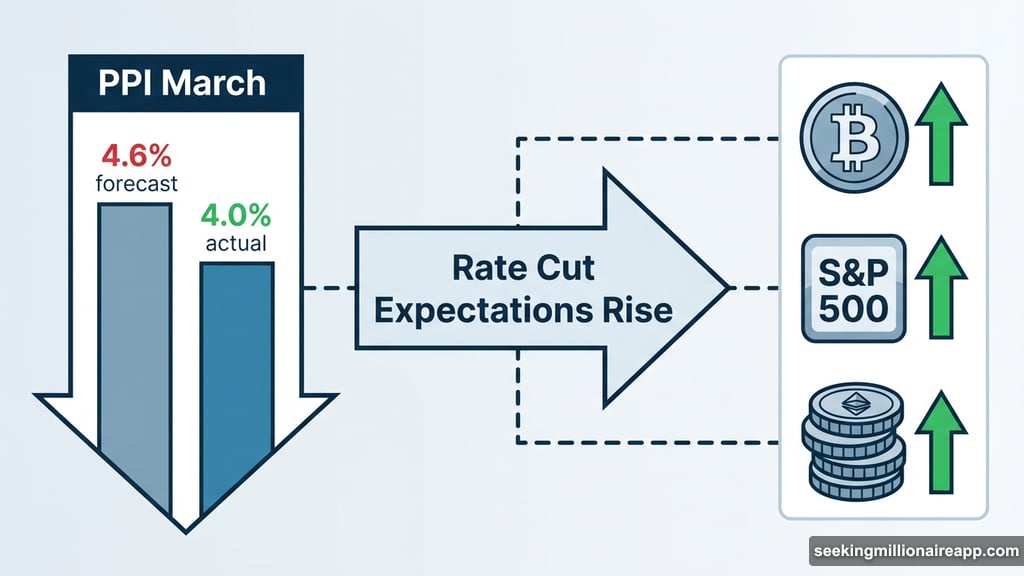
The Producer Price Index (PPI) for March came in at 4.0% year over year. That’s well below the 4.6% forecast economists expected. Monthly wholesale prices rose just 0.5%, less than half the projected 1.1% gain.
So why does that matter for crypto? Lower inflation data eases pressure on the Federal Reserve to keep interest rates high. When rate cuts look more likely, investors get bolder. They shift money out of safe havens and into higher-risk assets like stocks and crypto.
The S&P 500 confirmed this shift, closing April 14 up 1.18%. Money flowed into equities and digital assets at the same time. That simultaneous move tells you how powerful the PPI shock was for overall market sentiment.
Crypto Market Cap Tests a Critical Fibonacci Level
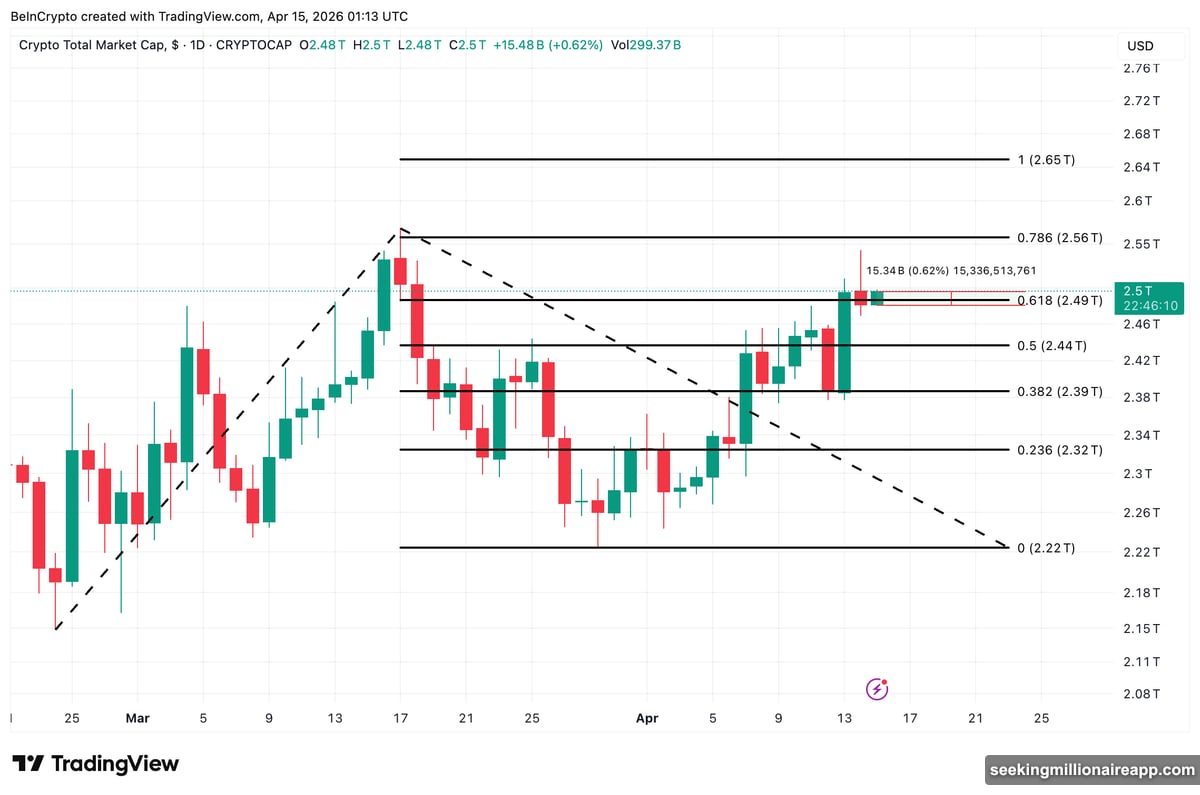
The total crypto market cap held above $2.49 trillion — and that number matters more than it might seem.
That $2.49 trillion level aligns with the 0.618 Fibonacci retracement, a widely-watched technical threshold that traders use to gauge market strength. It acted as resistance for weeks. Now it’s being tested as support for the first time, which is a meaningful flip in market structure.
If that support holds, the next targets are $2.56 trillion and $2.65 trillion. But a breakdown below $2.49 trillion would put $2.39 trillion and $2.32 trillion in play as the next downside levels.
Beyond the macro data, two significant industry developments also added confidence. Kraken confirmed a confidential US IPO filing, with Deutsche Börse set to invest $200 million for roughly a 1.5% stake. And 21Shares updated its Hyperliquid ETF filing with the ticker $THYP, moving closer to a US-listed product following SEC feedback. Both signal growing institutional engagement with the crypto space.
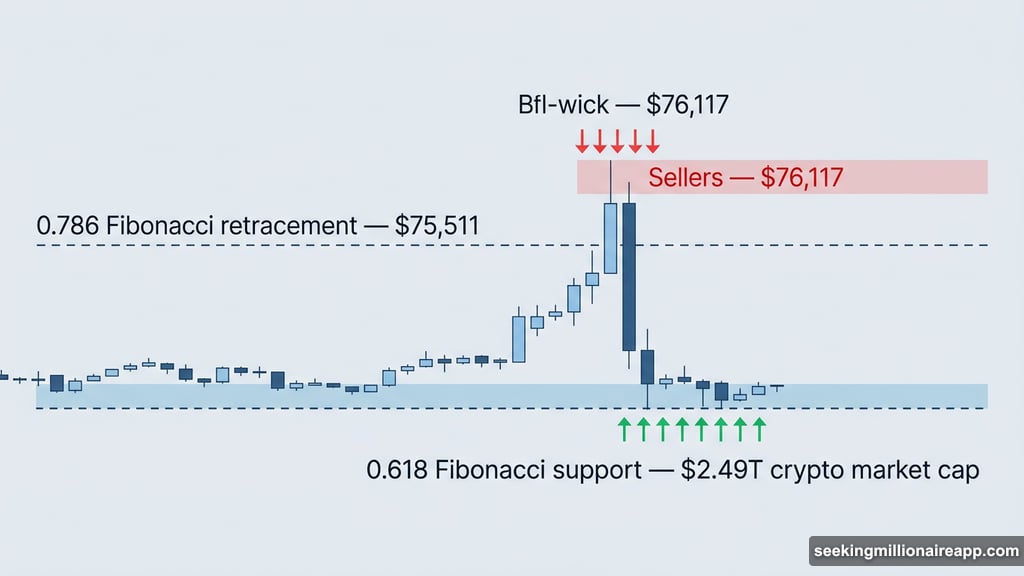
Bitcoin Breaks $75,000 but Sellers Show Up Fast
Bitcoin had a strong session — though it ran into resistance right when things got interesting.
BTC climbed 0.8% to $74,743, then briefly broke above $75,511. That level represents the 0.786 Fibonacci retracement, and it’s been a key line in the sand. Sellers stepped in sharply near $76,117, and the resulting long upper wick on the April 14 daily candle tells the story clearly: profit-taking pressure was real at that level.
Still, BTC didn’t collapse after that rejection. It held above $73,249, the 0.618 Fibonacci support that saw multiple tests over the past week before finally giving way to the upside. That’s an encouraging sign.
The PPI tailwind and improving geopolitical sentiment — including a fragile US-Iran ceasefire holding despite ongoing naval tensions — are keeping buyers engaged. However, traders need to see a confirmed daily close above $75,511 to trust the move. Without that confirmation, the breakout attempt looks incomplete.
A confirmed close above $75,511 puts $78,392 in sight as the next major target. On the downside, losing $73,249 would shift the short-term outlook bearish, with $71,660 and $70,072 as the next support levels to watch.
MemeCore Rallies 96% in 30 Days, Forms Bull Flag Near All-Time High
While Bitcoin grabbed headlines, MemeCore quietly put together one of the most impressive performances in the top 100.
The token, currently ranked 23rd by market cap, gained 5.6% today alone. But zoom out and the picture gets even more striking — MemeCore is up roughly 96% over the past 30 days. That makes it one of the strongest performers among large-cap altcoins by a wide margin.
The improving macro conditions helped. When risk appetite rises across the board, tokens with strong momentum tend to attract the most attention. MemeCore fit that profile perfectly.
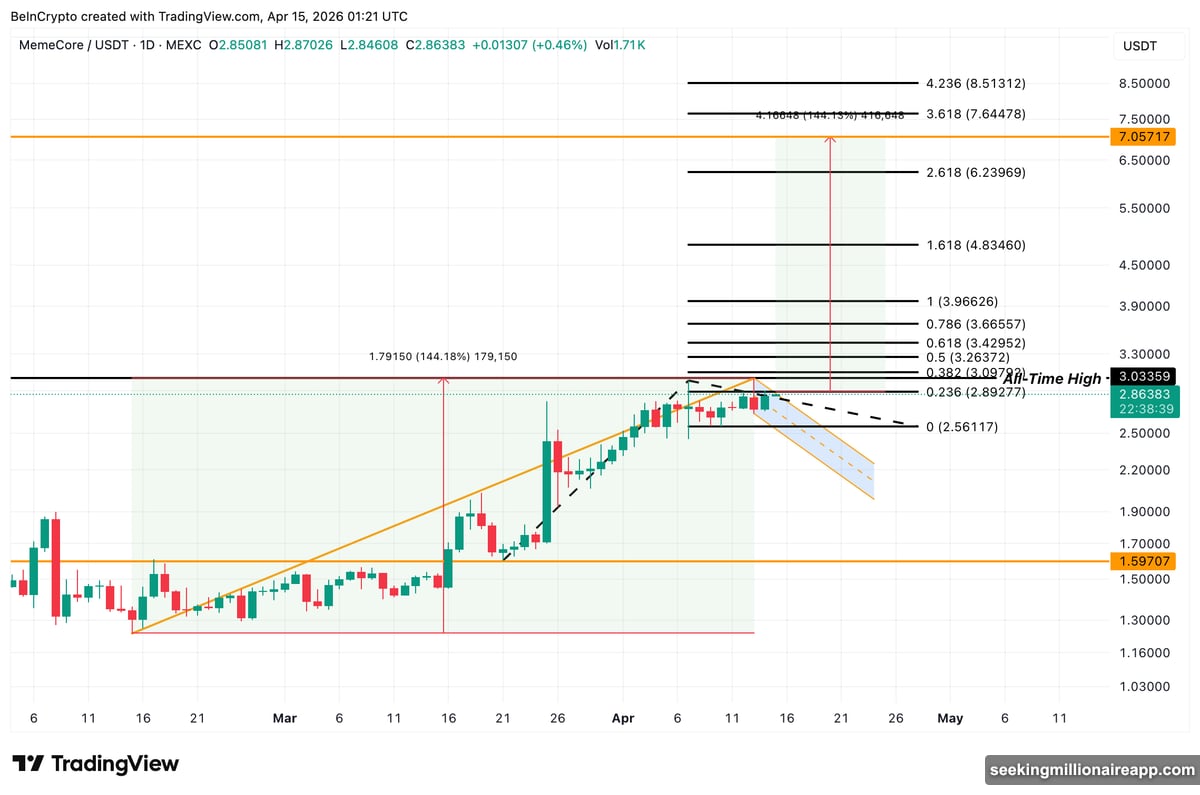
Technically, the daily chart shows a bull flag and pole pattern forming. The original pole measured a 144% rally, which is the kind of explosive move that sets up powerful continuation patterns. The token recently touched an all-time high near $3.03 before pulling back slightly into the flag structure.
A confirmed close above $2.89 — the upper trendline of the flag — would reopen the $3.03 all-time high as the immediate target. Breaking past that level projects further targets at $3.42, $3.96, and eventually $7.05 based on the full pole projection. A cross above $4.83 would confirm the long-term measured move.
On the downside, losing $2.56 would weaken the flag structure. A drop below $1.59 would fully invalidate the pattern. For now, $2.89 is the line that separates a push to new highs from a return into the flag’s lower range.
What Today’s Move Actually Tells Us
This wasn’t a random crypto pump. It was a coordinated risk-on move driven by genuine macro catalyst — one of the clearest examples in recent months of traditional financial data directly moving digital asset prices.
The PPI miss gave investors exactly the signal they’ve been waiting for. Rate cut expectations rose, institutional confidence showed up through the Kraken IPO news and the 21Shares ETF progress, and the market responded accordingly.
The critical question now is whether Bitcoin can close convincingly above $75,511 and whether total market cap can defend $2.49 trillion as support. Those two levels will likely decide whether today’s gains turn into a sustained recovery or another failed breakout attempt.
Watch the Bitcoin daily close closely. That single data point will tell you more about the next week of price action than any headline could.