
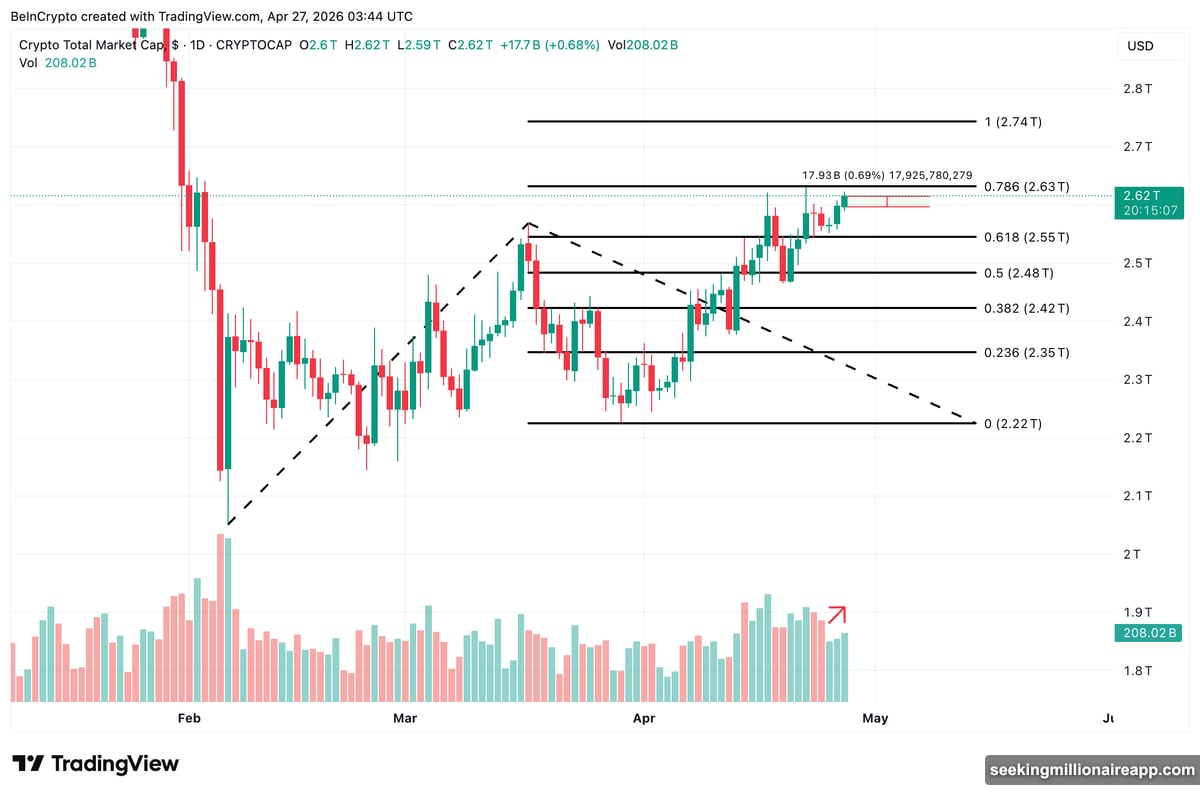
The crypto market is having a solid Monday. Total market cap rose 0.69% to $2.62 trillion, adding nearly $18 billion in 24 hours — and the move looks genuine.
What’s driving it? Four consecutive weeks of Bitcoin ETF inflows, plus capital rotating out of US equities. Markets are also positioning ahead of Wednesday’s Federal Open Market Committee (FOMC) meeting, which adds both opportunity and risk to this week’s outlook.
Let’s look at what the charts and data are actually saying.
Bitcoin ETF Inflows Push Total Market Cap to $2.62 Trillion
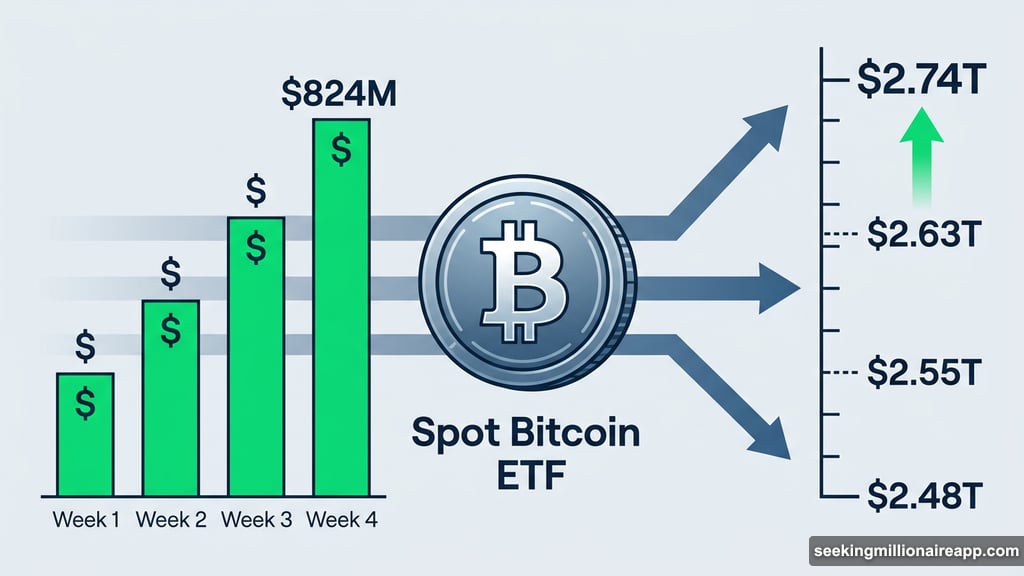
Spot Bitcoin ETFs pulled in $824 million in net inflows from April 20 to April 24, according to Wu Blockchain. That’s four weeks running of positive flows — a meaningful signal that institutional demand remains steady.
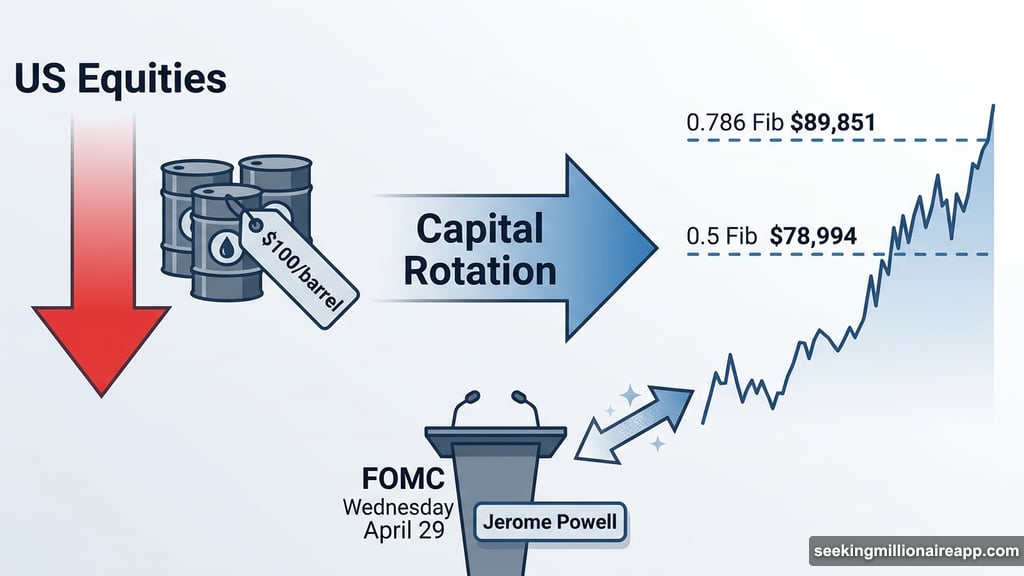
Meanwhile, US equities closed lower last week. Iran ceasefire uncertainty and oil prices pushing near $100 per barrel weighed on broader risk sentiment. Some of that capital appears to be rotating into crypto instead.
Volume bars on the daily market cap chart have trended higher alongside price since the bounce began. That pattern matters. It suggests this isn’t just a low-volume drift upward — there’s real spot demand behind it.
The key level to watch now is $2.63 trillion. That’s the 0.786 Fibonacci retracement zone, and it has capped every recent rally attempt. A clean break above $2.63 trillion opens the path toward $2.74 trillion. But if price gets rejected here again, the first support sits at $2.55 trillion, with $2.48 trillion below that.
Wednesday’s FOMC outcome will likely decide which way this breaks.
Bitcoin Price Faces a Volume Divergence Warning at $78,994
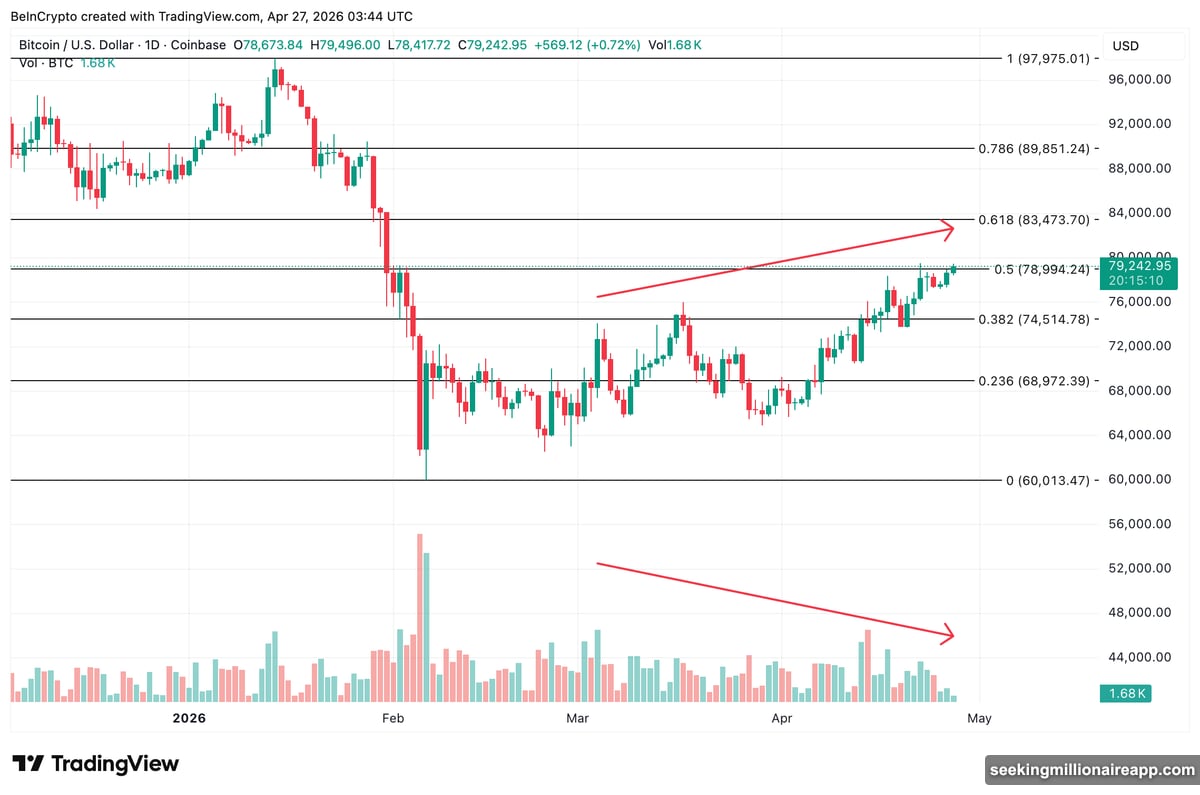
Bitcoin trades at $79,242, up 0.72% over the past 24 hours. The price action looks fine on the surface. But there’s a warning sign worth paying attention to.
Since March 4, BTC has pushed into successive higher swing highs. However, the volume behind each push has steadily declined. That’s called a bearish volume divergence — price keeps climbing, but fewer buyers are actually stepping in to support each new high.
ETF inflows are holding up, which offers some counterbalance. Still, the fading volume means the rally is running on thinner fuel than it appears.
The decisive level is $78,994, the 0.5 Fibonacci retracement. Bitcoin hasn’t managed a clean daily close above it yet. A confirmed break above $78,994 keeps the bullish case alive and targets $83,473 next, then $89,851 at the 0.786 Fibonacci level.
On the downside, a rejection here exposes $74,514 first, with $68,972 as deeper support. So this single level is doing a lot of work right now — separating a continuation rally from a potential pre-FOMC unwind.
Jerome Powell chairs his final FOMC press conference on Wednesday, April 29. Rates are frozen at 3.50% to 3.75%, and Powell’s successor Kevin Warsh has signaled tighter quantitative tightening rather than rate cuts. If the tone comes across less dovish than markets expect, that volume weakness in Bitcoin could become the trigger for a sharper pullback.
Pudgy Penguins Surges 16% After Cup and Handle Breakout
Pudgy Penguins (PENGU) is the standout performer today, trading at $0.00993 — up nearly 16% in 24 hours. That extends its 30-day rally to an impressive 55.5%.
The technical setup here is clean. PENGU broke out of a cup and handle pattern on April 22. The 36.15% measured projection from that breakout pointed to $0.0102, and price hit that target before pulling back. That kind of precision means sellers were waiting right at the projection level and started booking profits.
Now the question is whether buyers step back in or the rally cools further. Volume has declined since April 26 even as price held its gains — a classic sign that momentum is fading after a successful breakout move.
Key support sits at $0.0090, which aligns with the 1.0 Fibonacci extension. A drop below $0.0090 opens the door to $0.0082 and $0.0079. On the upside, a push above $0.0103 on fresh buying volume would target $0.0124 as the next level.
For now, $0.0090 is the line between healthy post-breakout consolidation and a deeper unwind.
What Wednesday’s FOMC Really Means for Crypto
Here’s the honest read on this week. The crypto market has genuine tailwinds — sustained ETF inflows, equity rotation, and solid technical setups across several assets. That’s real.
But Wednesday carries real risk too. If Powell’s final press conference signals a more hawkish tone than expected, the volume divergence in Bitcoin becomes a problem fast. Markets positioned for dovishness could reprice quickly.
The setup is bullish while it holds. But $78,994 in Bitcoin and $2.63 trillion in total market cap are the levels that matter most right now. Watch those closely Wednesday afternoon. How price responds to the FOMC decision at those specific levels will tell you everything about where this market heads next.