XRP is quietly building something interesting near $1.43. Multiple timeframes are lining up in a way that traders haven’t seen in a while, and the setup is worth paying attention to.
A cup and handle pattern on the 4-hour chart points toward a $1.70 target. At the same time, a confirmed weekly golden cross and some unusually compressed volatility are adding fuel to the bullish case. Whether you follow technical analysis closely or just want to understand what’s driving XRP chatter right now, let’s walk through what the charts are actually saying.
The Weekly Golden Cross XRP Traders Have Been Watching
Start with the big picture. XRP’s weekly chart shows the price sitting right on the lower boundary of a long-term ascending parallel channel, drawn on a logarithmic scale.
This is actually the third time XRP has tested that support level. The first two times — in 2017 and mid-2024 — both preceded strong rallies. That history matters, but it’s not the most exciting part.
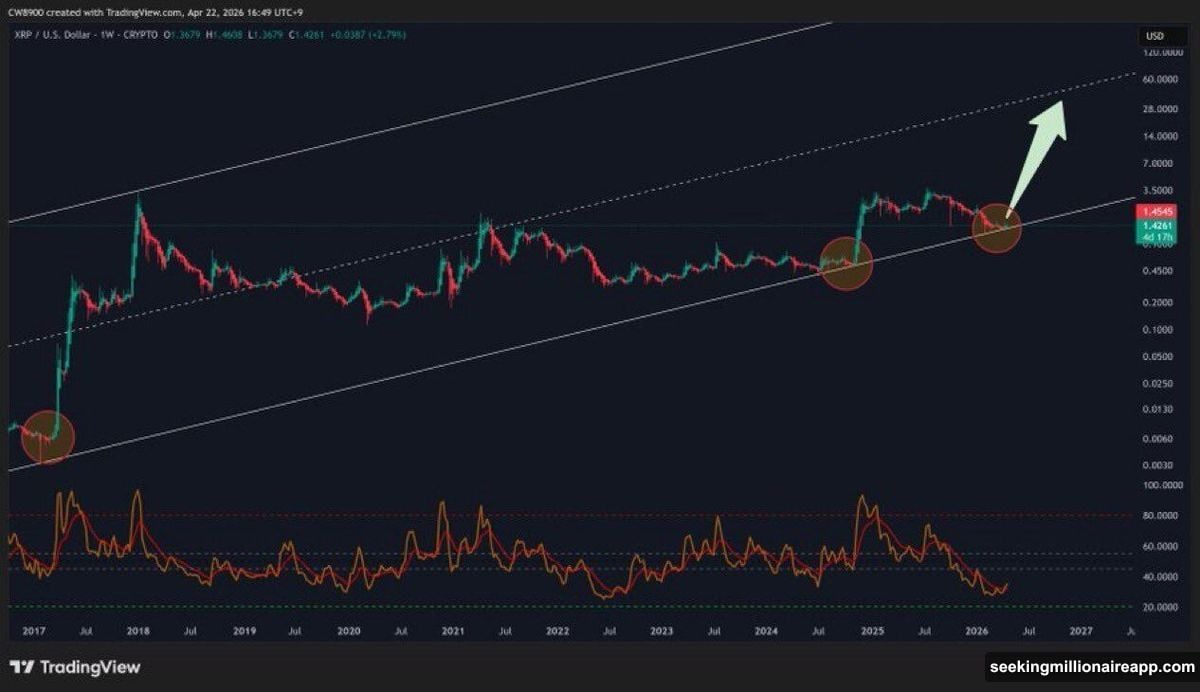
The more significant signal is the confirmed weekly golden cross. For those unfamiliar, a golden cross happens when a shorter-term moving average crosses above a longer-term one. On a weekly chart, these are rare. And historically, they’ve marked the beginning of sustained uptrends in XRP’s price cycles.
Crypto analyst XrpUdate captured the sentiment pretty well: “XRP JUST CONFIRMED A GOLDEN CROSS. Years of consolidation — ready to expand. The structure is screaming continuation. This is where smart money loads.”
The channel midline, which analyst XrpUdate eyes as the next major target, currently sits in the $30 range on a longer time horizon. That’s a long way out. But the key point is that the macro structure looks healthy. A clean breakdown below channel support would flip that narrative fast, so the $1.30 floor matters more than most people realize.
Volatility Compression and the RSI Triangle
Zoom into the daily chart and things get more detailed. XRP is currently pinned to the 0.236 Fibonacci retracement level at $1.42. Support sits at $1.30 and resistance at $1.53, with the Fibonacci grid anchored to January’s rally top at $2.42.
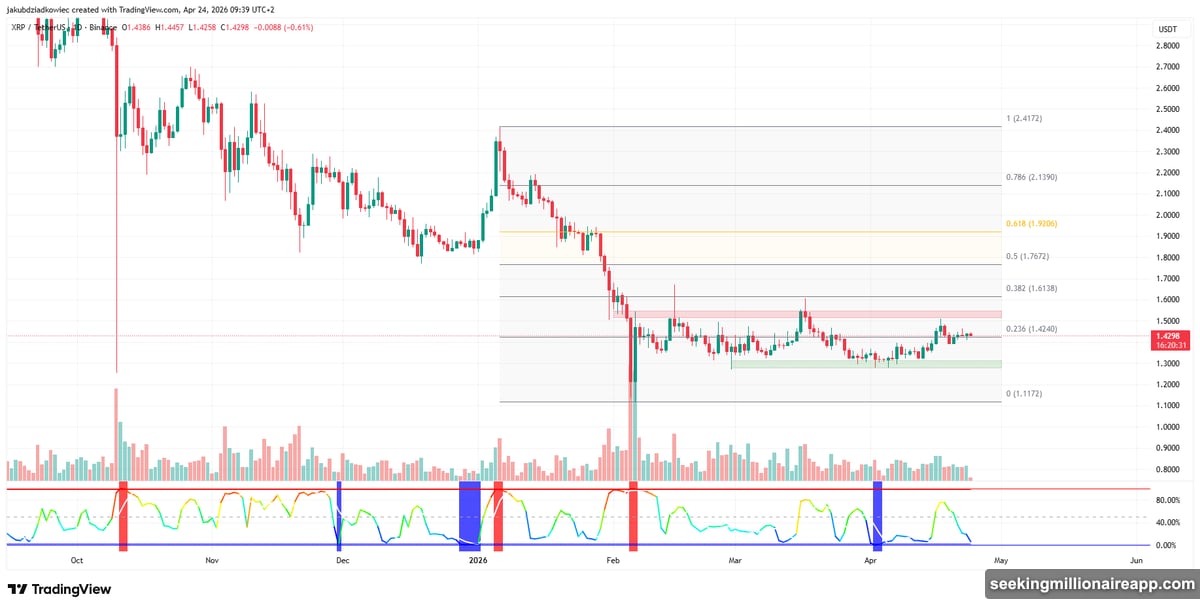
The really striking signal here is what’s happening with volatility. The Bollinger Band Width Percentile (BBWP) has collapsed toward zero and is flashing blue. In plain terms, XRP’s price is moving in an unusually tight range. That kind of compression almost never lasts forever. Historically, it’s preceded sharp directional moves — though the direction isn’t guaranteed by the compression alone.
Declining volume throughout April supports the idea that long-term holders are quietly absorbing supply. That’s a pattern often associated with accumulation phases, where patient buyers soak up available coins before a bigger move draws in retail traders.
Then there’s the RSI triangle. Since July 2025, the daily Relative Strength Index (RSI) has formed a contracting triangle pattern. Resistance has been sloping down from a high of 88 last summer. Support has been rising from the February 2026 low near 18. Right now, the RSI sits around 55 — almost exactly in the middle of that narrowing range.
A break above 60 on the RSI would align with a bullish momentum shift. A drop below 45 would be a warning sign. Either way, the apex of that triangle is approaching, and a resolution looks close.
Cup and Handle Pattern Points to $1.6933
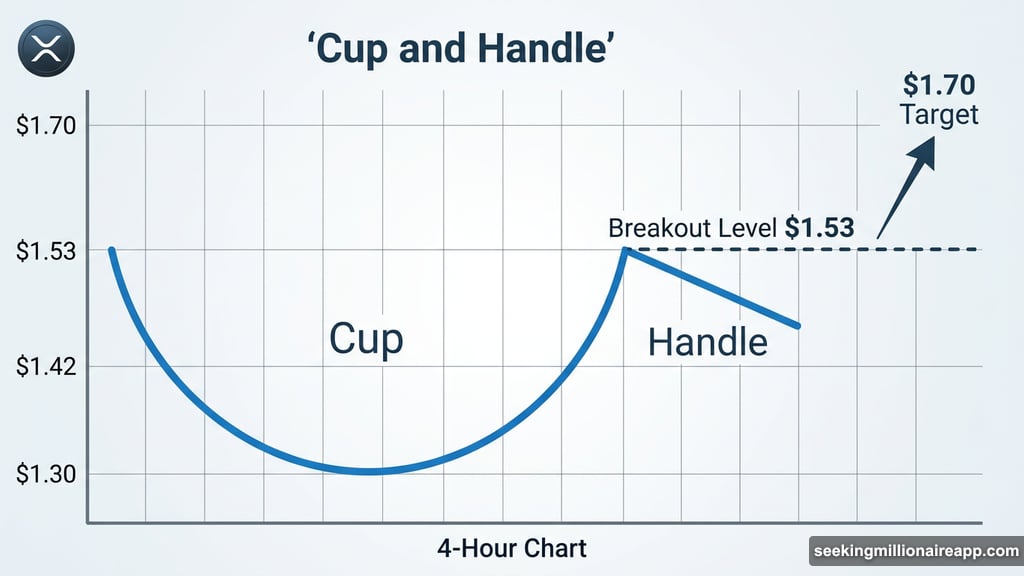
Now for the most specific and near-term signal. On the 4-hour XRP/USDT chart on Binance, a classic cup and handle pattern has been forming.
The cup stretches from the March low near $1.30 up to an April peak at $1.50. The handle is currently forming right on the 0.236 Fibonacci line at $1.42. This is textbook structure — a rounded recovery followed by a short consolidation before the potential breakout.
A clean break above the $1.50 neckline would measure to a price target of $1.6933. That level sits between the 0.382 and 0.5 Fibonacci retracements of the recent leg down. From current levels around $1.43, that represents roughly 18% upside.
The 4-hour RSI sits near 50 — neutral, not overheated. That actually supports the accumulation thesis. Exhausted or overextended charts look different. This one still has room to run if buyers step in at the right moment.
The invalidation level is equally clear. If $1.30 breaks before the pattern completes, the cup and handle setup gets erased. That’s the line in the sand.
What All Three Timeframes Are Saying Together
Here’s what makes this setup interesting. The signals across weekly, daily, and 4-hour charts are pointing in the same direction at the same time.
The weekly golden cross and channel structure favor long-term bulls. The daily volatility compression and RSI triangle signal a move is coming soon. The 4-hour cup and handle gives a specific near-term target with clear invalidation levels.
That kind of alignment doesn’t happen constantly. When it does, it tends to resolve with a decisive move rather than continued sideways trading.
Of course, technical setups fail. Breakouts get faked. The crypto market has a long history of doing the unexpected. But the risk levels here are well-defined. Watch $1.30 as the floor and $1.50 as the trigger. If XRP holds the floor and clears the neckline, the $1.70 zone comes into play quickly.
The chart has done the work of setting this up. Now it’s a matter of whether the buyers show up when it counts.