The crypto market is having a rough Friday. Oil prices climbing above $104, red US stock charts, and thinning weekend liquidity all hit at the same time — and the result is a broad pullback across digital assets.
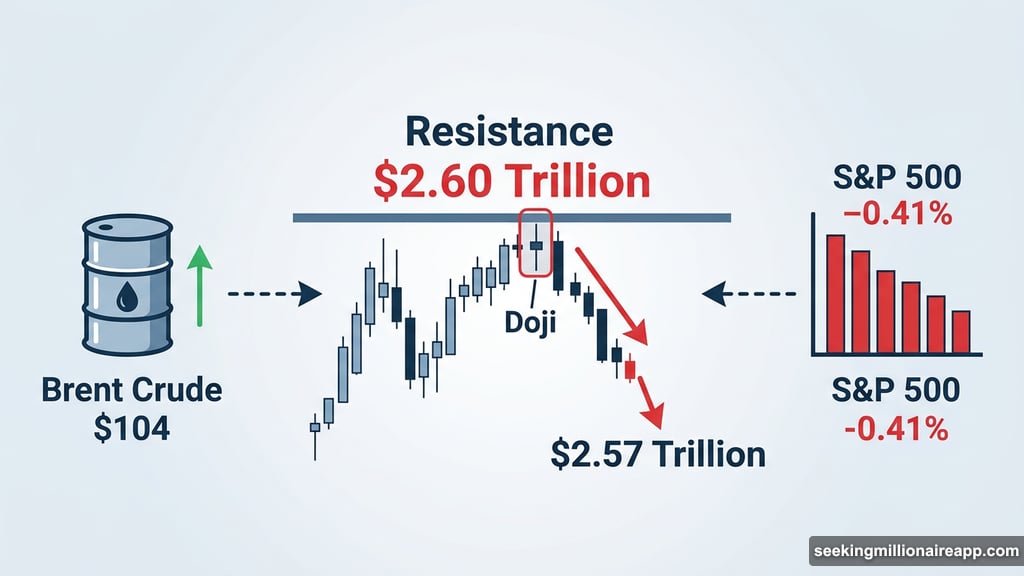
The total crypto market cap (TOTAL) dropped 1.35% from Thursday’s high, settling around $2.57 trillion. That stubborn $2.60 trillion resistance level held firm once again. Bitcoin slipped 0.68% on the day to trade around $77,751, while Quant (QNT) took the hardest hit among major tokens, falling about 3% over 24 hours to $71.30.
So what’s actually driving this? Let’s break it down.
$2.60 Trillion Resistance Caps the Crypto Market Cap
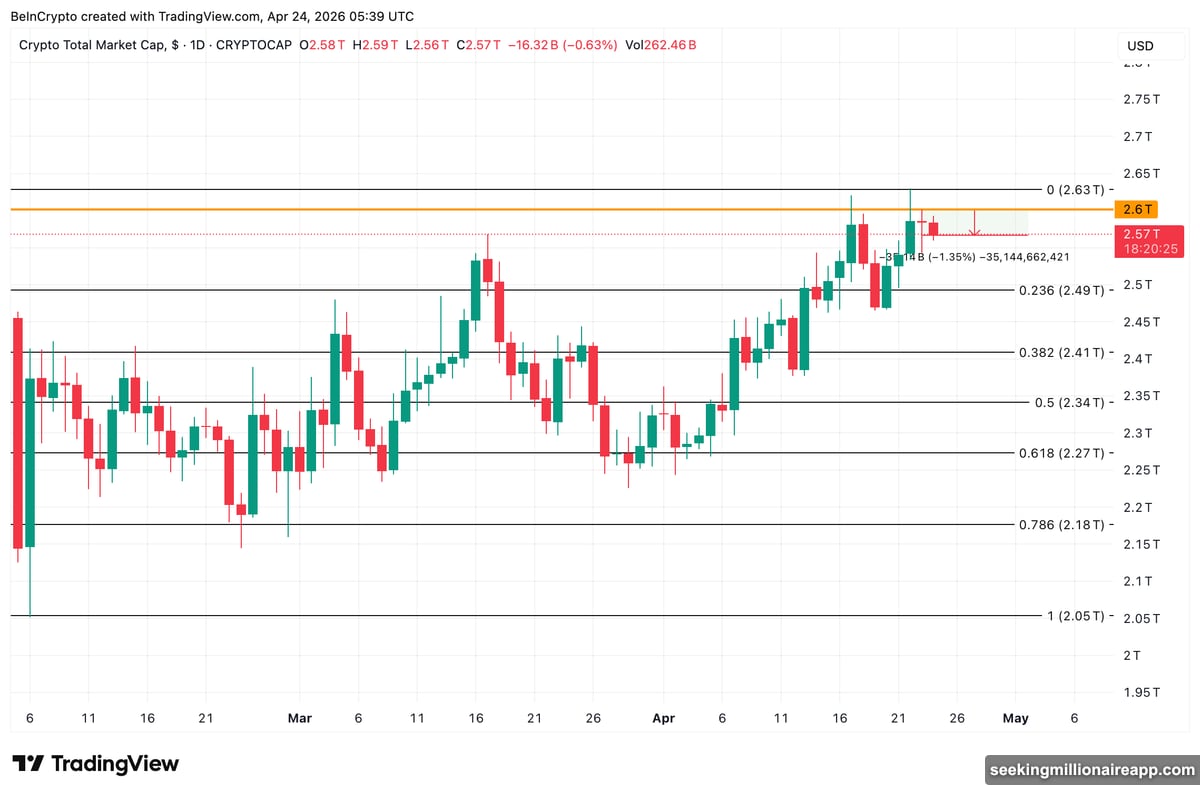
The total market cap printed an indecisive Doji candle near $2.60 trillion on Wednesday — basically the chart equivalent of a shrug. Then it rolled over.
That pullback isn’t random. It tracks a clear risk-off mood across broader markets. The S&P 500 closed down 0.41% Thursday, with software stocks dragging things lower. Meanwhile, Brent crude pushed back above $104 on fresh Iran tensions, squashing the brief relief rally that followed ceasefire hopes.
The capital rotation story — where money was expected to flow back into equities and risk assets — has stalled. Funds are sitting on their hands rather than redeploying ahead of the weekend. That matters because lower weekend liquidity historically amplifies moves in whichever direction the market is already heading.
On the charts, $2.49 trillion is the first support level to watch if selling continues. Anything above that keeps a bounce technically possible. But a clean break below $2.49 trillion opens the door toward $2.41 trillion and then $2.34 trillion. On the upside, bulls need a close above $2.63 trillion to shift momentum back in their favor.
![Total crypto market cap chart showing resistance at $2.60 trillion and support levels below $2.49 trillion on TradingView]
Bitcoin Volume Tells a Cautious Story
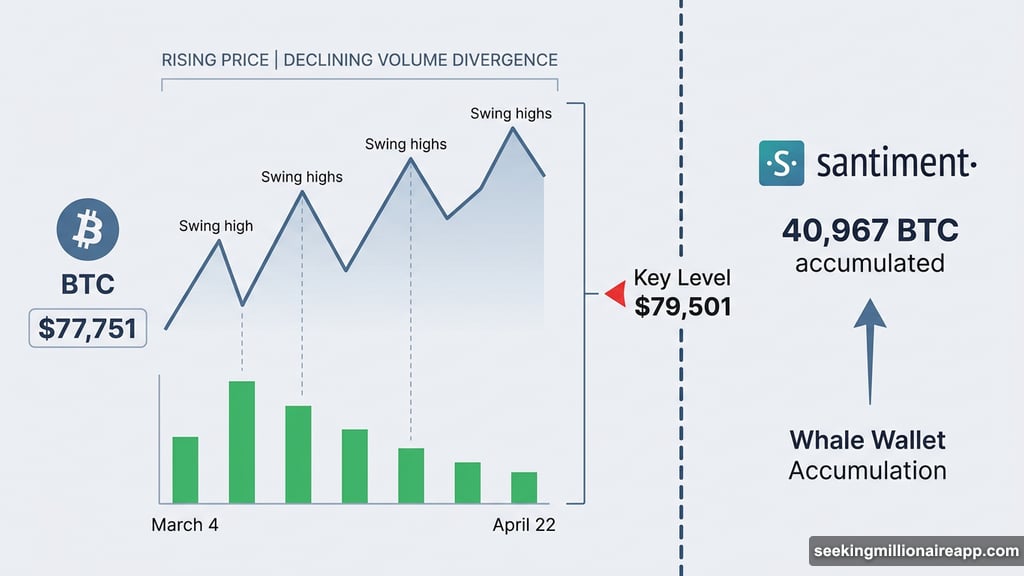
On the surface, Bitcoin looks fine. It’s trading around $77,751, up roughly 10% over the past month, and Santiment data shows key stakeholder wallets accumulated 40,967 BTC over just the past two weeks. That’s a bullish on-chain signal.
But dig into the volume data and the picture gets more complicated.
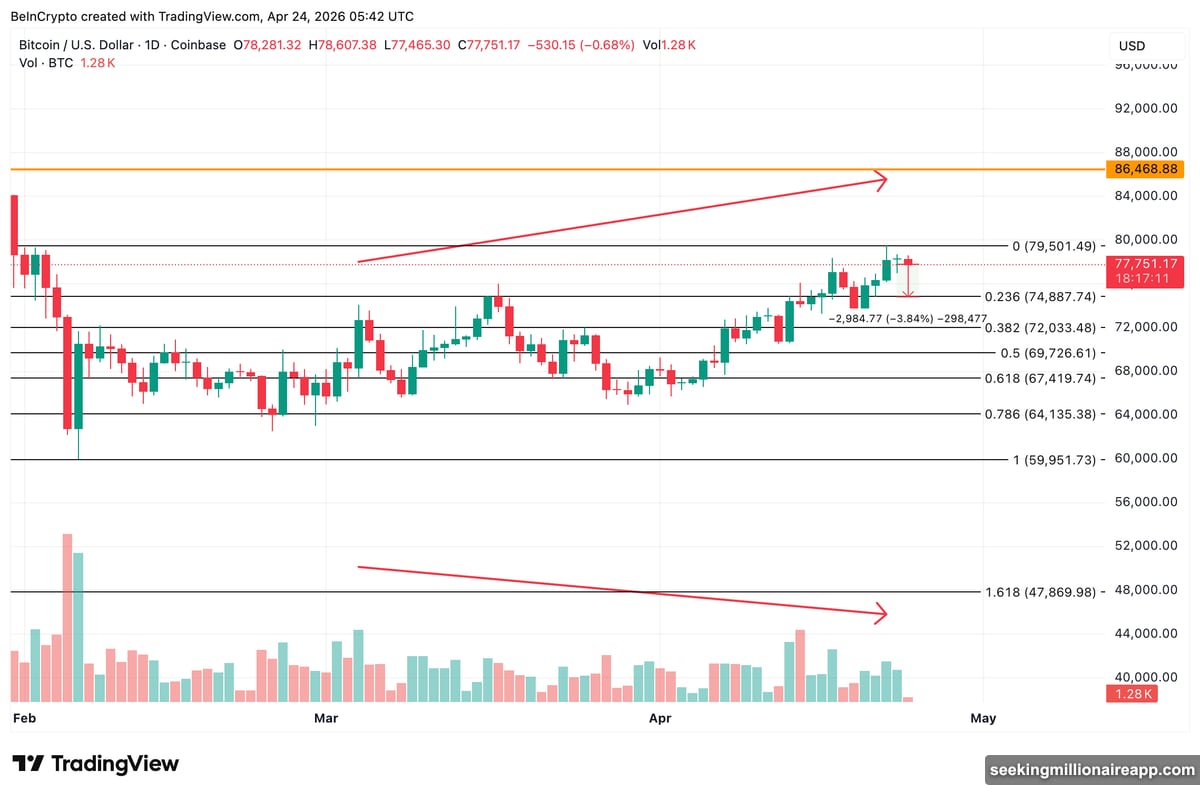
Between March 4 and April 22, Bitcoin printed higher swing highs — meaning the price kept reaching new peaks. However, the volume behind each of those highs was actually declining. That divergence is a classic warning sign. Rising prices on falling volume often means buying pressure is losing steam, even if the price hasn’t broken down yet.
The key level right now is $79,501, the swing high from April 22 that formed on notably light volume. A daily close above that level would neutralize the volume warning and open up room to push higher. Without it, though, Bitcoin looks vulnerable.
If BTC fails to clear $79,501 and weekend liquidity dries up further, $74,887 becomes the first downside target. Below that, $72,033 and $69,726 are the deeper support zones traders are watching.
Quant (QNT) Symmetrical Triangle Breakdown Looms
Quant is arguably the most technically vulnerable chart in the market right now. The token has been consolidating inside a symmetrical triangle pattern since mid-January — a formation that typically signals a buyer-seller stalemate waiting to break one way or the other.
The April 17 correction pushed QNT below both its 20-day Exponential Moving Average (EMA) at $73.57 and its 100-day EMA at $73.10. EMAs are trend lines that smooth out price action over time, and when price falls below them it often signals weakening momentum. Now the 20-day EMA is closing in on the 100-day EMA from above. If those two lines cross, it creates what traders call a bearish EMA crossover — a setup that historically precedes further selling.
Add the oil-driven risk-off environment and thin weekend liquidity on top of that, and QNT looks exposed.
![Quant (QNT) price chart showing symmetrical triangle pattern, EMA crossover setup, and Fibonacci support at $70.95 on TradingView]
The pivotal number is $70.95. That’s both the 0.382 Fibonacci retracement level and the lower boundary of the triangle. A daily close below $70.95 would confirm a triangle breakdown and open targets at $67.65 and then $64.34 — roughly a 10% drop from current prices.
On the flip side, Quant can reset this bearish setup. Reclaiming the $73 EMA cluster and pushing above $75.04 would neutralize the pattern. The real bullish test sits at $81.65. For now though, $70.95 is the line in the sand.
Three News Items Worth Watching
Beyond the price action, a few stories are worth keeping on your radar this weekend.
Wisconsin regulators sued Kalshi, Coinbase, Polymarket, Robinhood, and Crypto.com this week, alleging that prediction market event contracts operate as unlicensed gambling rather than legitimate financial instruments. That legal fight could have broader implications for how prediction markets are regulated across the US.
ARK Invest’s Q1 2026 Bitcoin Quarterly report landed with a notable claim: the true cyclical bottom hasn’t arrived yet. Even so, conviction buyers grew their holdings by 69% to a combined 3.60 million BTC, suggesting long-term believers are still accumulating.
Finally, Robinhood Ventures opened private stakes in OpenAI, Stripe, Revolut, and Databricks to retail investors. The firm also secured Singapore regulatory approval for brokerage expansion — a move that signals growing ambitions in Asian markets.
What This Weekend Might Look Like
Fridays heading into low-liquidity weekends are historically tricky. Markets don’t need big catalysts to make big moves when fewer participants are trading. The combination of oil pushing higher, equities closing weak, and resistance holding at $2.60 trillion makes this a setup where patience probably beats aggression.
Watch $2.49 trillion on the total market cap, $74,887 on Bitcoin, and $70.95 on Quant. Those three levels will tell you a lot about where things are headed when Monday rolls around.
This analysis is for informational purposes only and should not be considered financial or investment advice. Always do your own research before making any financial decisions.