
Bitcoin is sitting near the top of a rising price channel, and everything that matters right now is pointing in the same direction — down.
Three technical warnings appeared in just three days. The largest Bitcoin holders started offloading billions in coins. And derivatives data shows long positions are dangerously overextended. The chart isn’t screaming breakout. It’s whispering something quieter and more concerning.
Here’s what’s actually happening under the hood.
The Ascending Channel Hiding a Quiet Problem
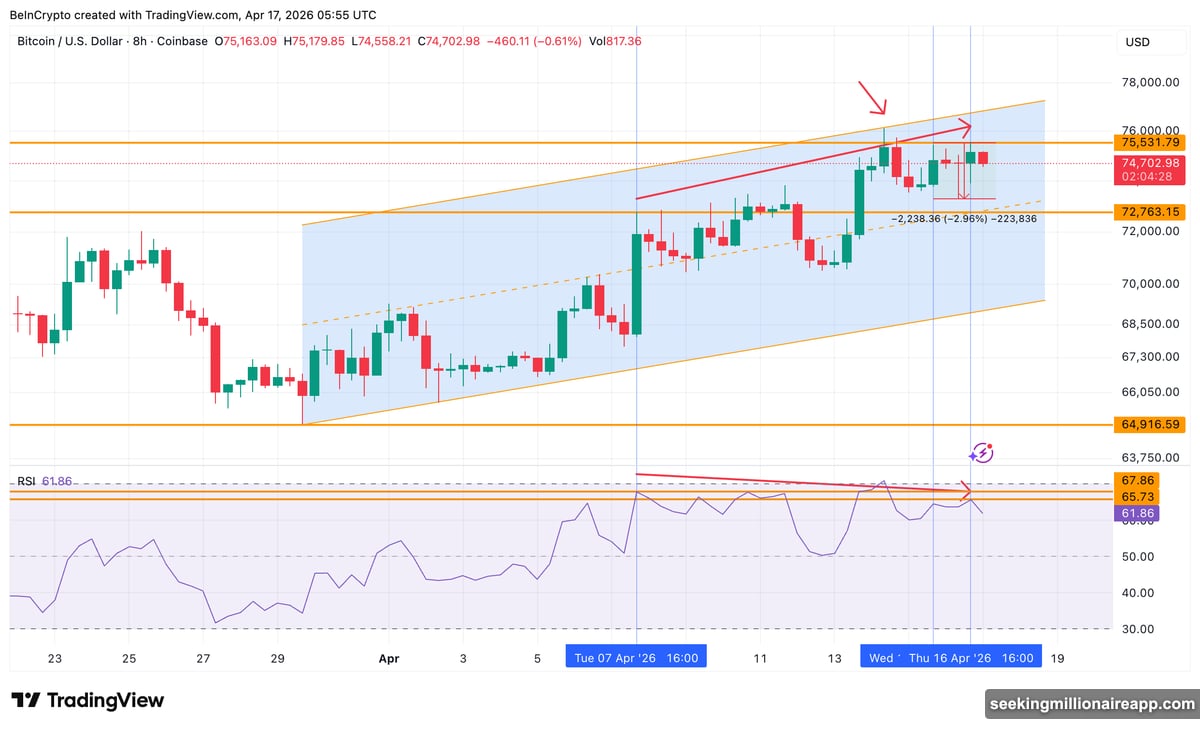
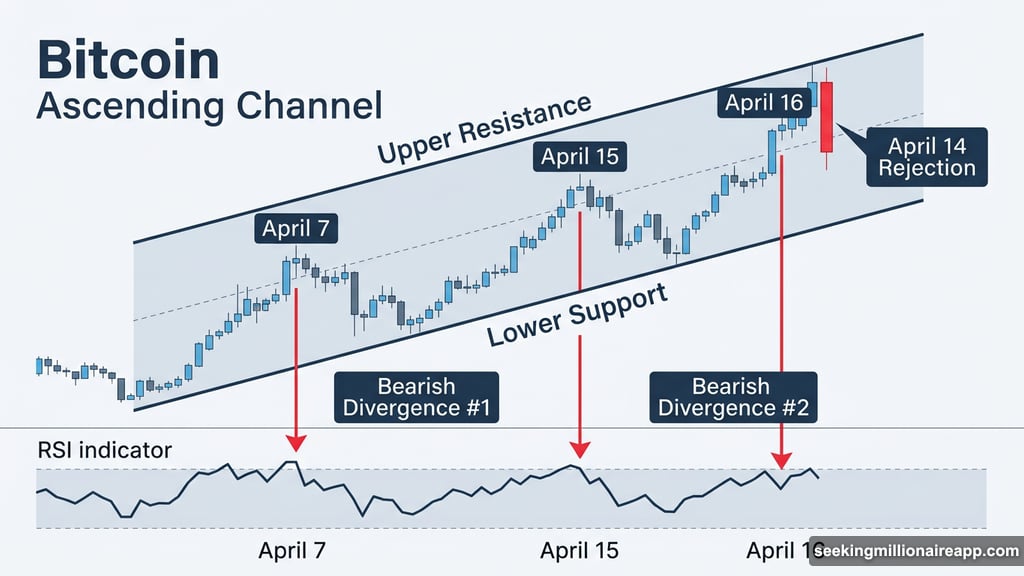
Since March 29, Bitcoin has been climbing inside a textbook ascending channel — a structure defined by a steady pattern of higher highs and higher lows. On paper, that looks bullish. And for most of that stretch, it was.
But between April 14 and April 16, three separate warning signals appeared inside that same channel. That changes the story considerably.
The first red flag showed up on April 14. Bitcoin approached the upper boundary of the channel and got rejected. No clean breakout. No follow-through. Just a quiet reversal that most people shrugged off.
Then things got more serious.
RSI Bearish Divergence Shows Up Twice in a Row
The second warning formed between April 7 and April 15. Bitcoin’s price printed a higher high — exactly what you’d expect inside a healthy uptrend. But the RSI, which measures momentum, made a lower high at the same time. That mismatch is called a bearish divergence, and it triggered a roughly 3% drop.
So far, one divergence. Uncomfortable, but not catastrophic.
Then the third warning arrived between April 7 and April 16. Bitcoin posted another higher high. The RSI made yet another lower high. That created two consecutive bearish divergences — back-to-back readings showing momentum collapsing even as price held up.
Back-to-back RSI divergences inside an ascending channel are rare. And they almost never resolve cleanly to the upside. One failed breakout plus two stacked divergences in the same week is a combination that tends to get resolved with a correction, not a rally.
The real question was whether the biggest Bitcoin holders had noticed.
Turns out, they had.
Bitcoin Whale Cohorts Offload Over 36,000 BTC in Days
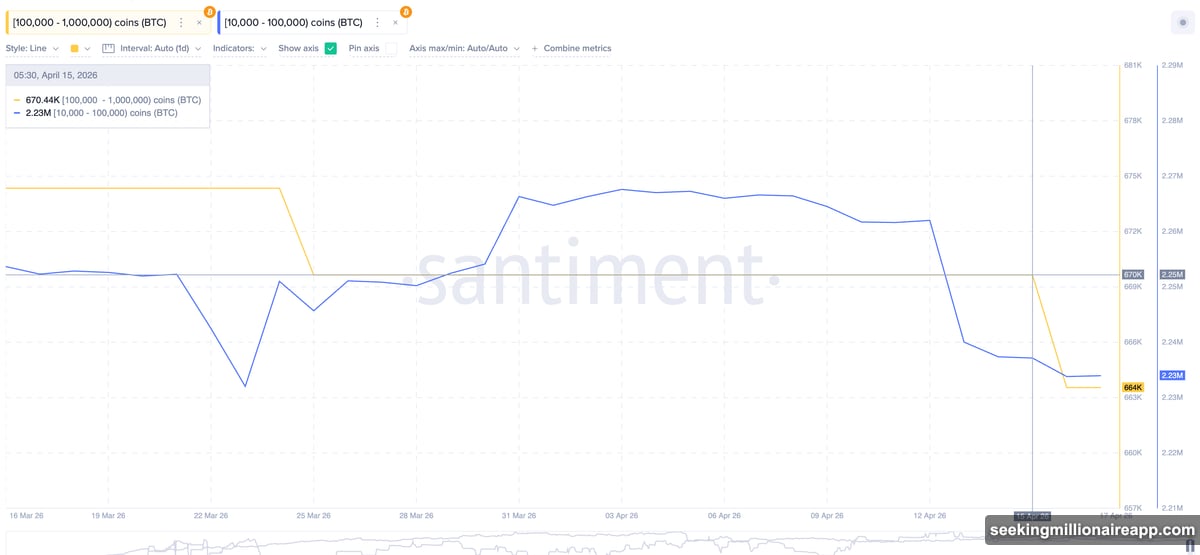
On-chain data from Santiment shows two of the largest Bitcoin whale cohorts reducing their holdings in near-perfect lockstep with those technical signals.
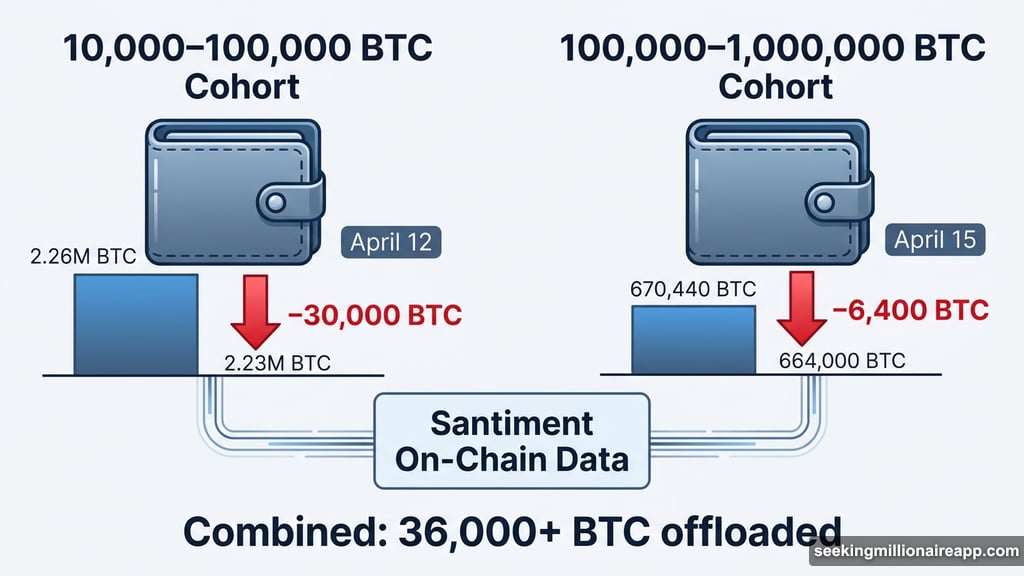
The cohort holding between 10,000 and 100,000 BTC started selling on April 12 — before the chart warnings even fully formed. Their collective stash dropped from 2.26 million BTC to about 2.23 million BTC. That’s roughly 30,000 BTC offloaded in under a week.
The larger cohort, holding between 100,000 and 1 million BTC, joined in on April 15. That timing lines up almost exactly with the first bearish divergence completing. Their holdings fell from 670,440 BTC to around 664,000 BTC — about 6,400 BTC sold.
Combined, the two largest whale groups dumped more than 36,000 BTC in less than seven days. At Bitcoin’s current price near $74,815, that’s well over $2.6 billion in selling pressure.
Whales don’t always telegraph their moves. But when their distribution timeline aligns this closely with technical deterioration, it’s worth paying attention.
The Liquidation Map Makes Things Worse for Bulls
Here’s where things get particularly uncomfortable for anyone holding leveraged long positions right now.
According to Bybit’s seven-day liquidation data pulled from Coinglass, cumulative long liquidation leverage stands at $2.37 billion. Short liquidation leverage sits at $1.31 billion. That’s nearly a 2-to-1 imbalance, with longs carrying significantly more risk.
What that means in plain language: if Bitcoin drops enough to start triggering those long positions, the forced selling accelerates the move lower. That’s the mechanics of a long squeeze. And right now, the conditions for one are stacking up — heavy long positioning, active whale distribution, and two consecutive momentum divergences on the chart.
None of these factors on their own guarantees a sell-off. But together, they create a setup where the path of least resistance looks lower, not higher.
Price Levels Worth Watching Right Now
Bitcoin at $74,815 sits between two critical decision points, and the next move from here will tell us a lot.
On the upside, the key level is $76,130. A clean 8-hour candle close above that would invalidate much of the bearish thesis, force short liquidations, and reopen the path higher. That’s the level bulls need to defend and reclaim.
On the downside, the first real support sits at $73,484, which corresponds to the 0.236 Fibonacci retracement level. If that breaks, the next support steps come in at $71,846 (0.382 Fibonacci) and $70,523 (0.5 Fibonacci).
A drop below $69,199 — the 0.618 Fibonacci level — would be the clearest signal that the ascending channel has failed. Below that, targets open at $67,315 and potentially $64,915. That would represent a meaningful structural breakdown, not just a routine pullback.
The line in the sand is simple. Hold $73,484 and bulls stay in the game. Lose it, and the whale distribution plus leveraged long positioning creates a recipe for a fast, uncomfortable correction.
The chart has been patient. It usually is. But three bearish warnings in three days, combined with over 36,000 BTC in whale selling, is not the kind of backdrop that tends to reward patience from anyone sitting on unprotected long exposure. Watch those levels closely.